
16.2% or 22.7%?
Average 129 EU banks’ own CET1 ratios and the sector looks six points stronger than it is. Sum the capital and the risk exposure first, then divide once.
Read it →Most of my 15+ years in BI has been in banking and financial services: regulatory returns, finance and risk MI, and remediation programmes where every figure gets checked. I design the semantic models and reporting behind that work, so the answer and where it came from arrive together.
Four problems I have written up on public data. Each passes a visual check and fails the first question a regulator, an auditor or a finance director would ask.
Average 129 EU banks’ own CET1 ratios and the sector looks six points stronger than it is. Sum the capital and the risk exposure first, then divide once.
Read it →Only two thirds of a card book had ever been checked for fraud. Divide by every transaction and the rate comes out a third too low.
See the report →The same 1.7m transactions as one flat table instead of a star schema: six times the memory, and a year-on-year figure wrong by a factor of seventeen.
See the measurements →Revenue 3.6% behind budget, EBITDA 26.2% behind. A P&L page has to show why the gap widened, not just that it did.
See the report →Returns such as COREP, FINREP, MLAR, Own Funds and Asset Encumbrance rebuilt as governed Power BI models: ratios recomputed from their components, item codes mapped, and every figure reconciled back to source.
OutcomeA 95% first-time UAT pass rate on regulatory BI releases.
Month-end, budget and variance reporting, portfolio performance that puts Finance, Commercial and Risk on one view, and KPI frameworks for programmes such as customer remediation, on certified semantic models rather than spreadsheets.
OutcomeManual consolidation effort cut by 80% by moving spreadsheet reporting onto one governed estate.
Lineage and reconciliation, row-level security, structured UAT and release governance, and model documentation that still makes sense after the person who built it has left.
OutcomeRefresh failures cut by over 60% after the finance data models were re-engineered.
Outcomes are from past engagements and left unattributed: client work sits behind NDAs.
Engagements as an employee, a contractor or through a consultancy. Each line is the work I was there to do.
Client work sits behind NDAs, so these are built on public data, with the model, the measures and the checks published alongside.
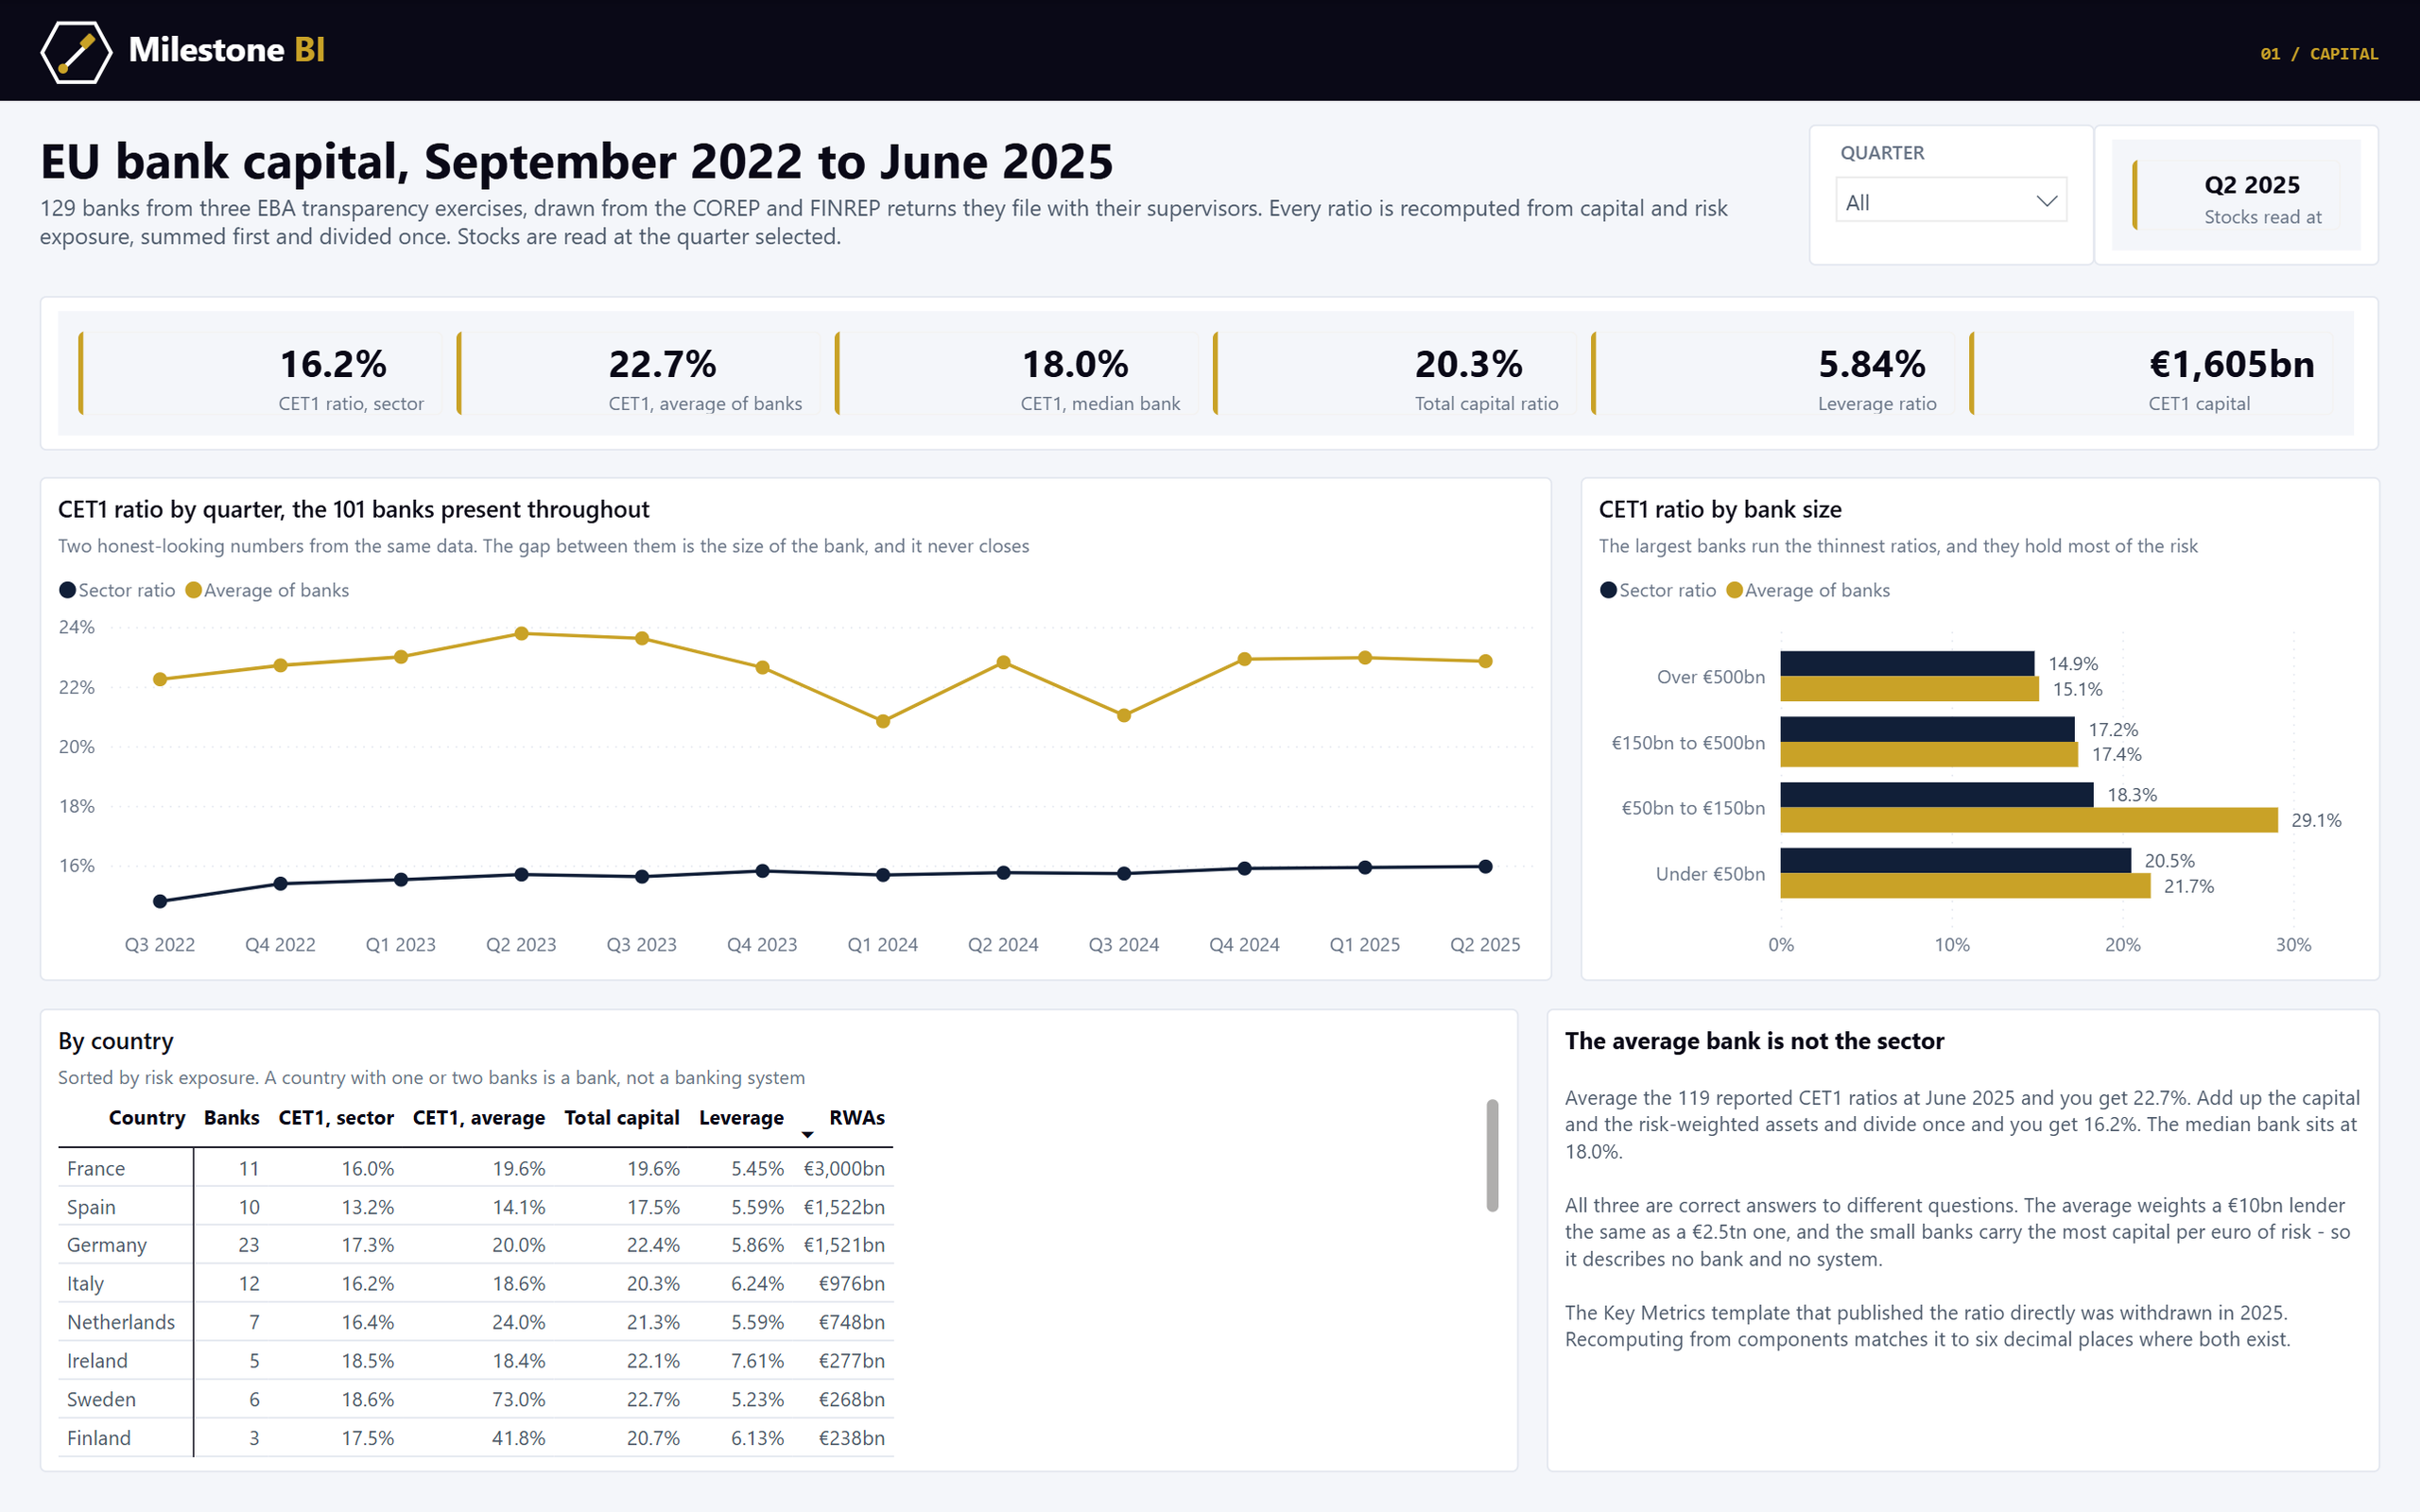
Three years of the COREP and FINREP returns 129 EU banks file with their supervisors, with every ratio recomputed from its components.
Explore the data →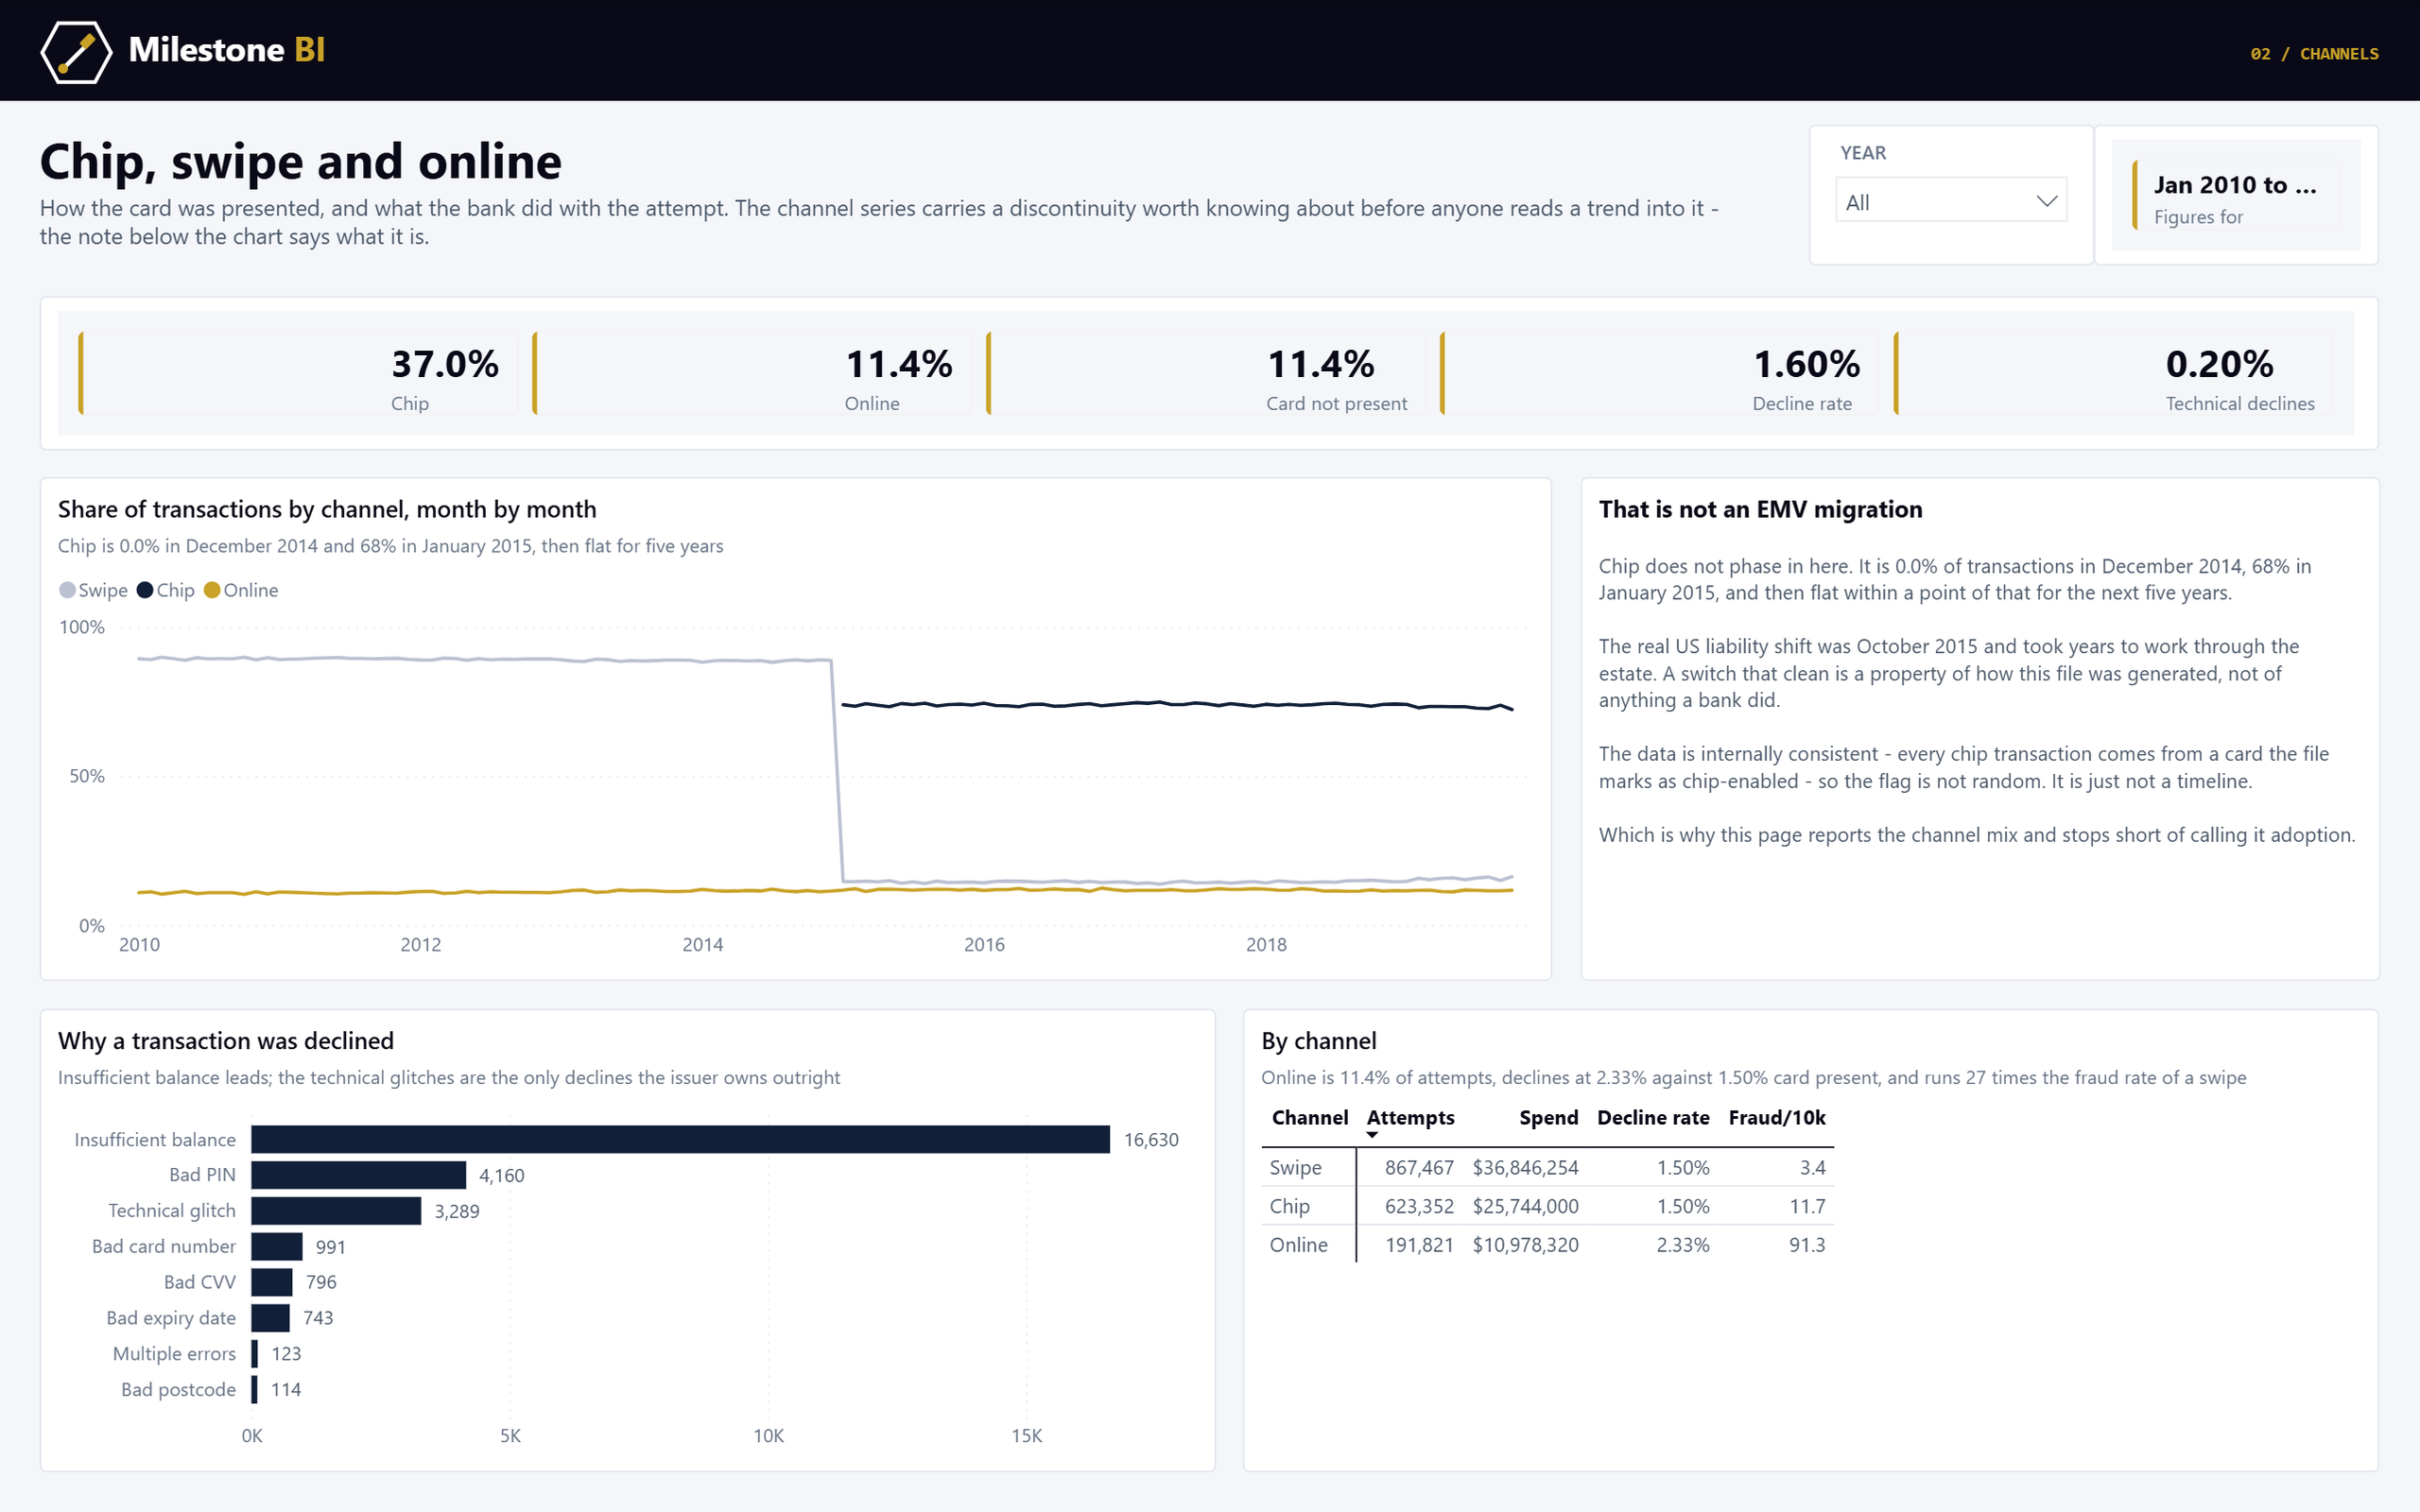
A decade of a bank’s card book: 1.7m transactions, what was declined, and what turned out to be fraud, with both denominators shown.
Explore the data →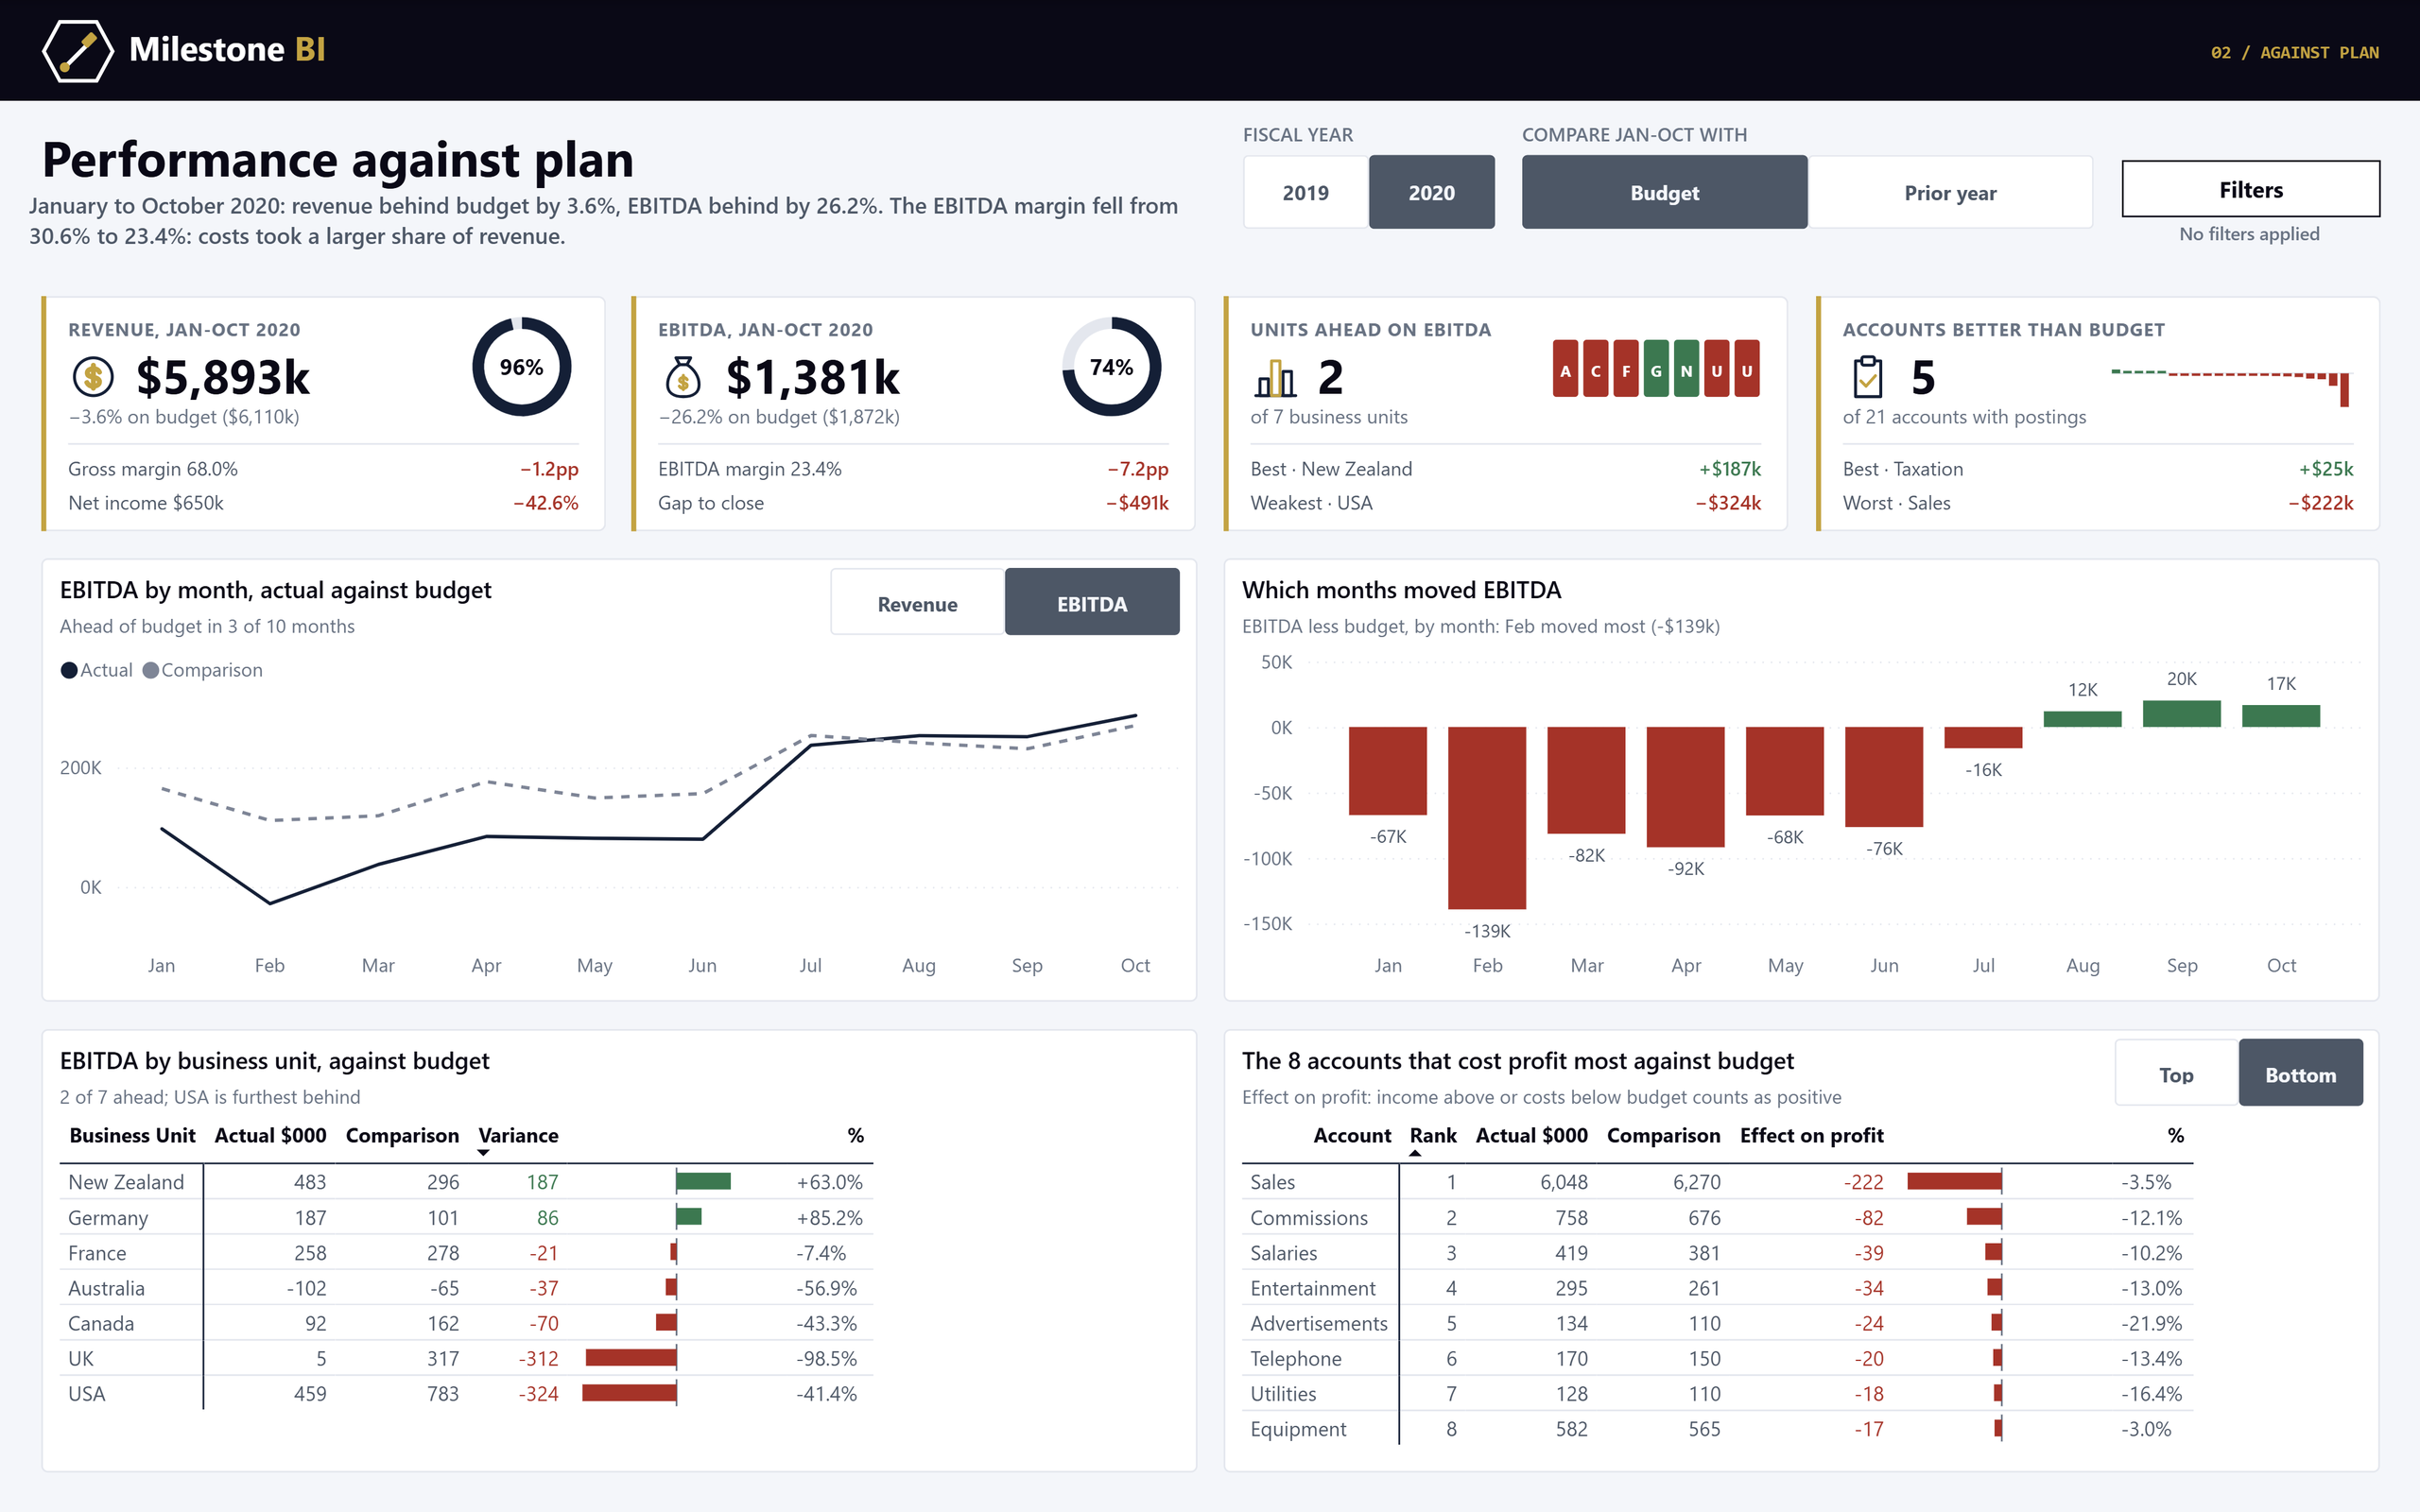
A full profit and loss statement built from a real general ledger, and a second page that explains the variance to budget.
Explore the data →An executive overview, a remediation action register and governed metric definitions in one place, so every status on the first page traces to an owner, a deadline and a calculation. Built on synthetic data.
Explore the framework →One report and the semantic model behind it: numbers, model, speed and access, with every finding ranked by impact and its fix written down.
Book a health check →What the review covers. Credited in full against a rebuild booked within 30 days.
The same report rebuilt on a documented star schema, with measures tested against source totals and a handover your team can maintain.
Book a rebuild →Regulatory returns or a whole estate? Get in touch and I’ll quote a fixed price.
Both, within limits. I have rebuilt core prudential returns as governed models inside a bank, and published a model of three years of EBA transparency data you can open. I am not a regulatory adviser: interpreting the rules stays with your regulatory reporting team. My job is making sure the numbers they sign off are right and traceable.
Usually. I’m happy to sign your NDA first, and I have worked inside bank environments under their access controls and release governance. For a review, an anonymised copy or a model with no data in it is enough for most of the work.
Power BI and Microsoft Fabric, on top of Azure SQL, Snowflake or Redshift. Most of the work is the semantic model over the warehouse you already have, not a new one.
Banks, lenders, wealth managers and finance teams in regulated firms: anyone whose numbers get checked by someone outside the team that built them.
I do: Omar Williams. Nothing gets handed to a junior. More about me.