
BI architecture & automation
Scalable, cloud-native architectures built for performance and maintainability, from ingestion through to semantic layer, with manual Excel workflows replaced by auditable pipelines.
I design cloud-native BI architectures for banks, financial institutions and enterprise clients: semantic models and reporting built to survive scrutiny, handover, and time.
Start a conversation →I help finance and data leaders turn fragmented information into a decision-making engine. 15+ years across banking, financial services, gaming, logistics and manufacturing, most of it on reporting that has to survive an audit as well as a board meeting.
That means cloud-native architectures, automated reporting pipelines, governance frameworks, and Power BI solutions that actually get used. Client work sits behind NDAs, so the evidence is in the portfolio →

Scalable, cloud-native architectures built for performance and maintainability, from ingestion through to semantic layer, with manual Excel workflows replaced by auditable pipelines.
Executive-grade dashboards that get adopted. Data modelling, DAX optimisation, and the training and change management that make teams actually use them.
Access controls, data quality standards and audit compliance built to meet regulatory requirements. Delivered Scrum-led, with structured UAT and full release governance.
Client work sits behind NDAs, so here are seven things you can inspect end to end, each mapped to the kind of work I do. Five of them below; the rest are in the portfolio.
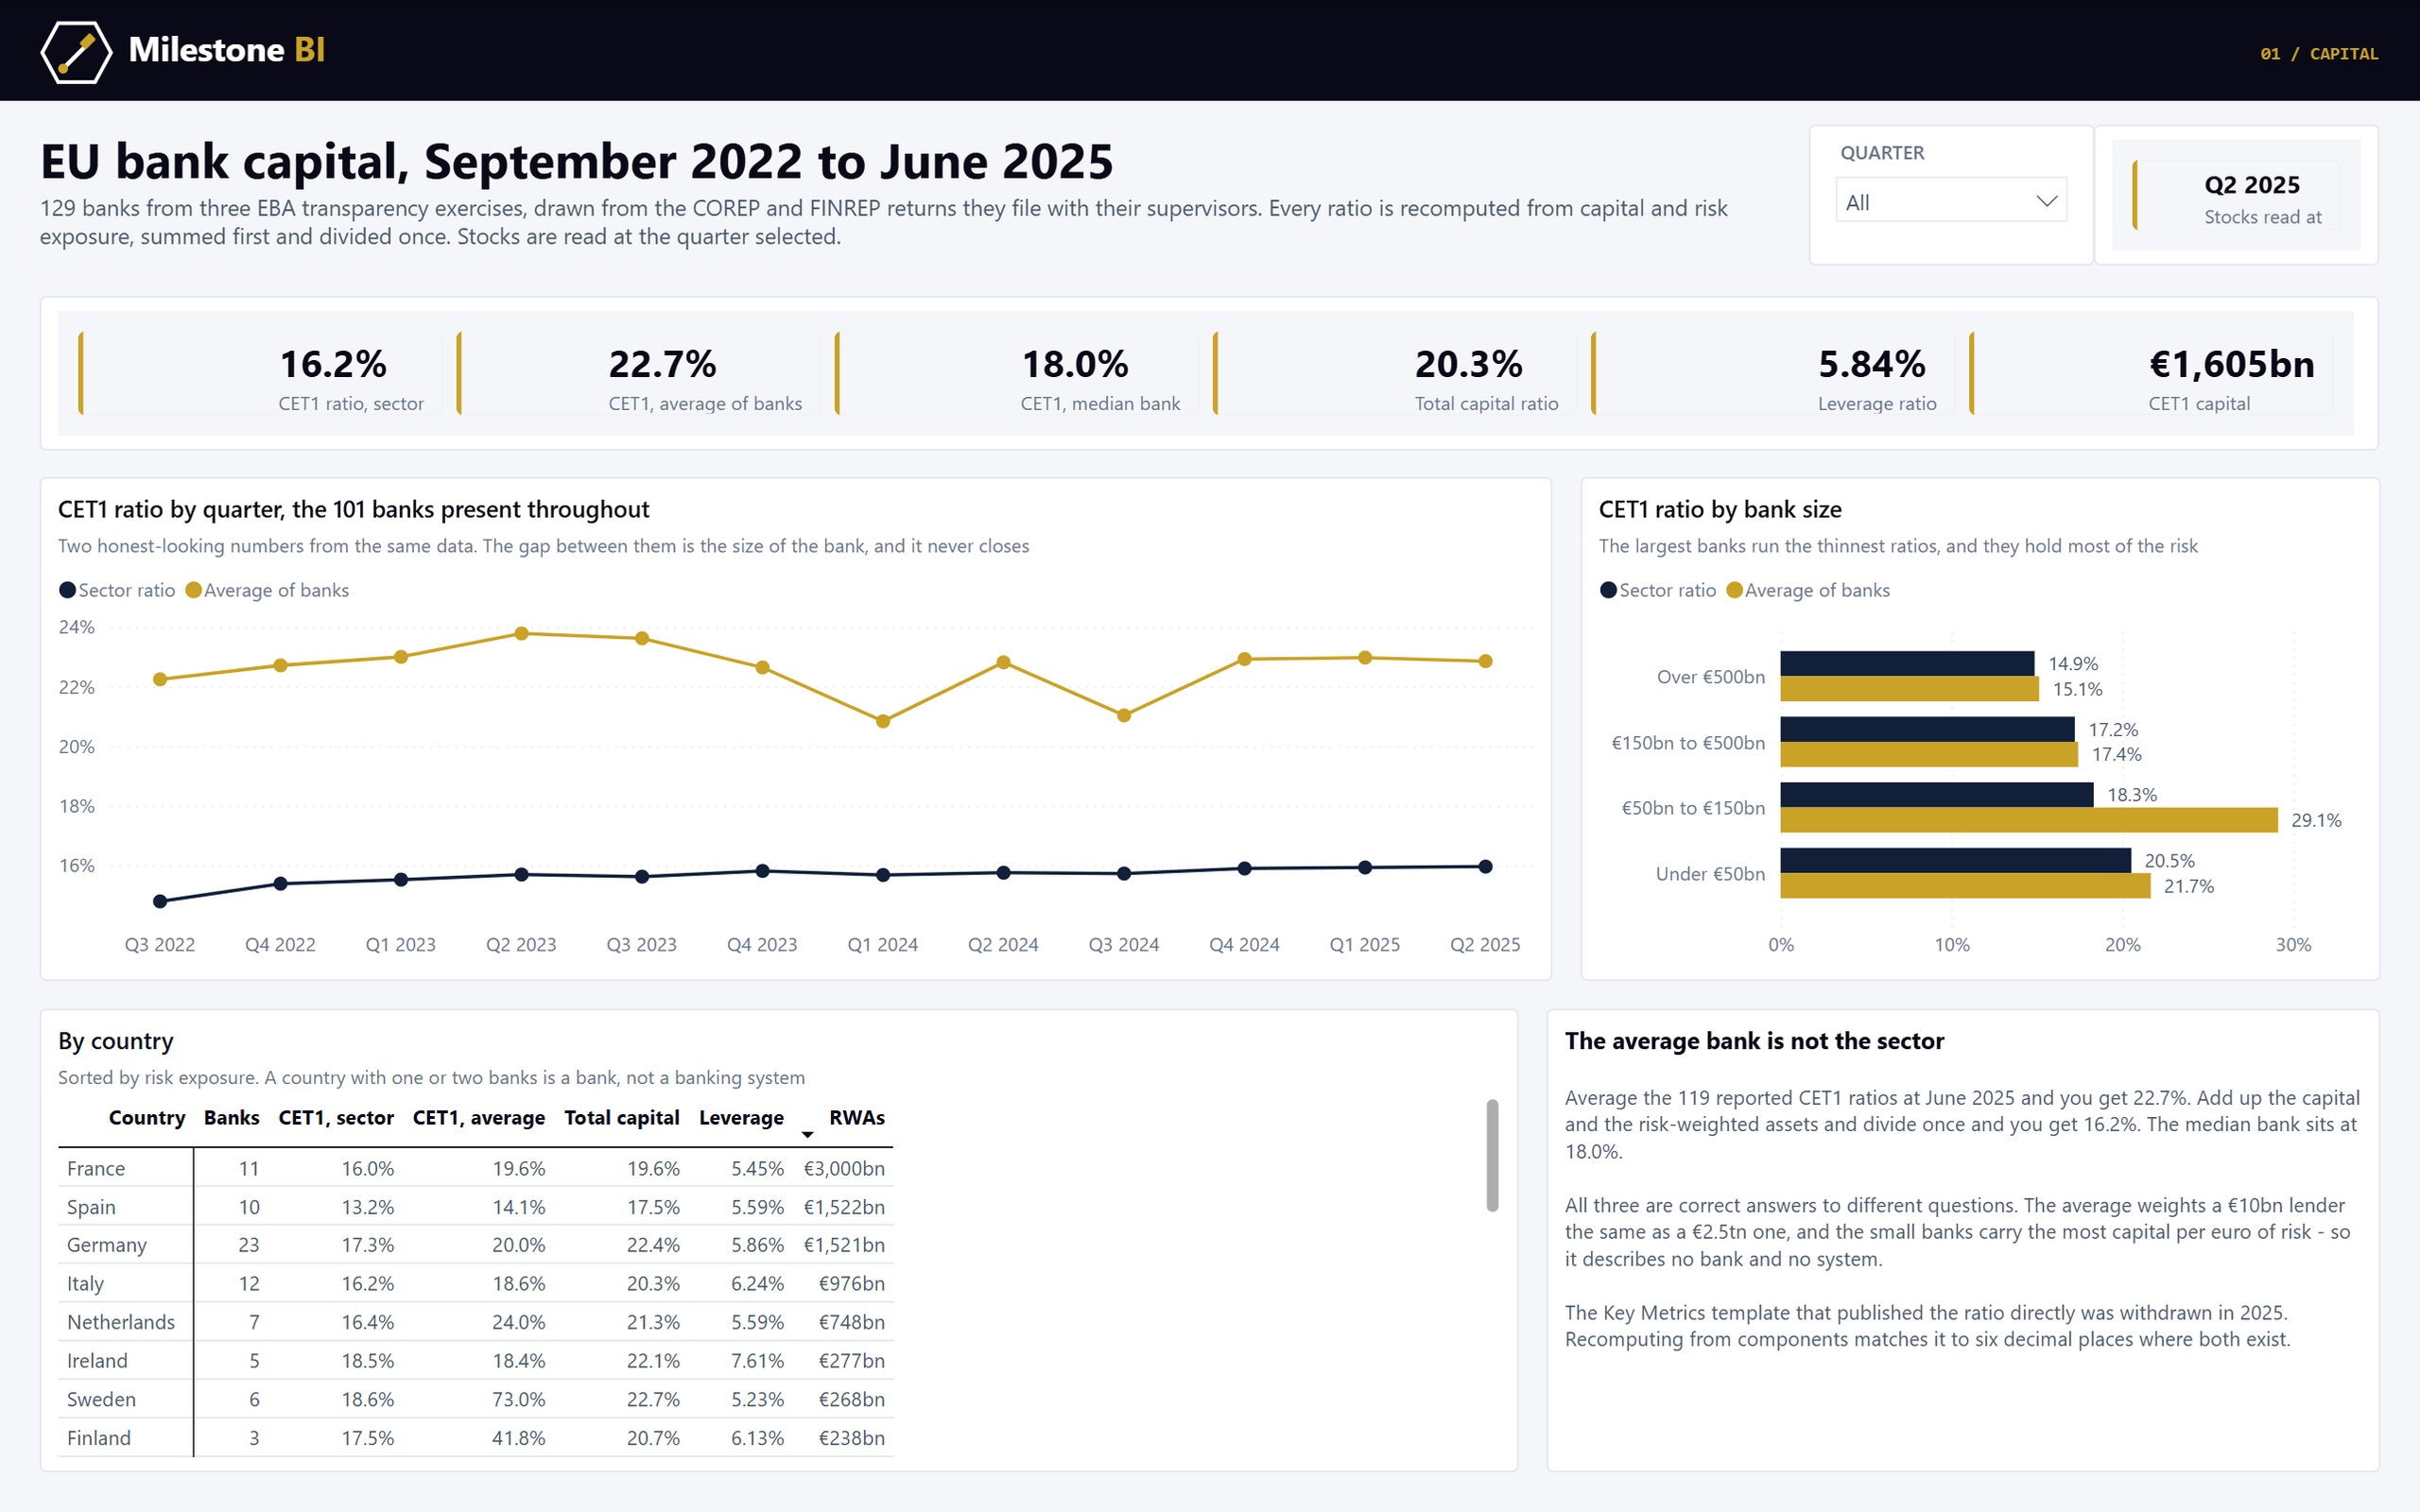
Three years of the COREP and FINREP returns 129 EU banks file with their supervisors. The sector’s CET1 ratio is 16.2%; average the banks’ own ratios and you get 22.7% — every ratio recomputed from its components.
Explore the data →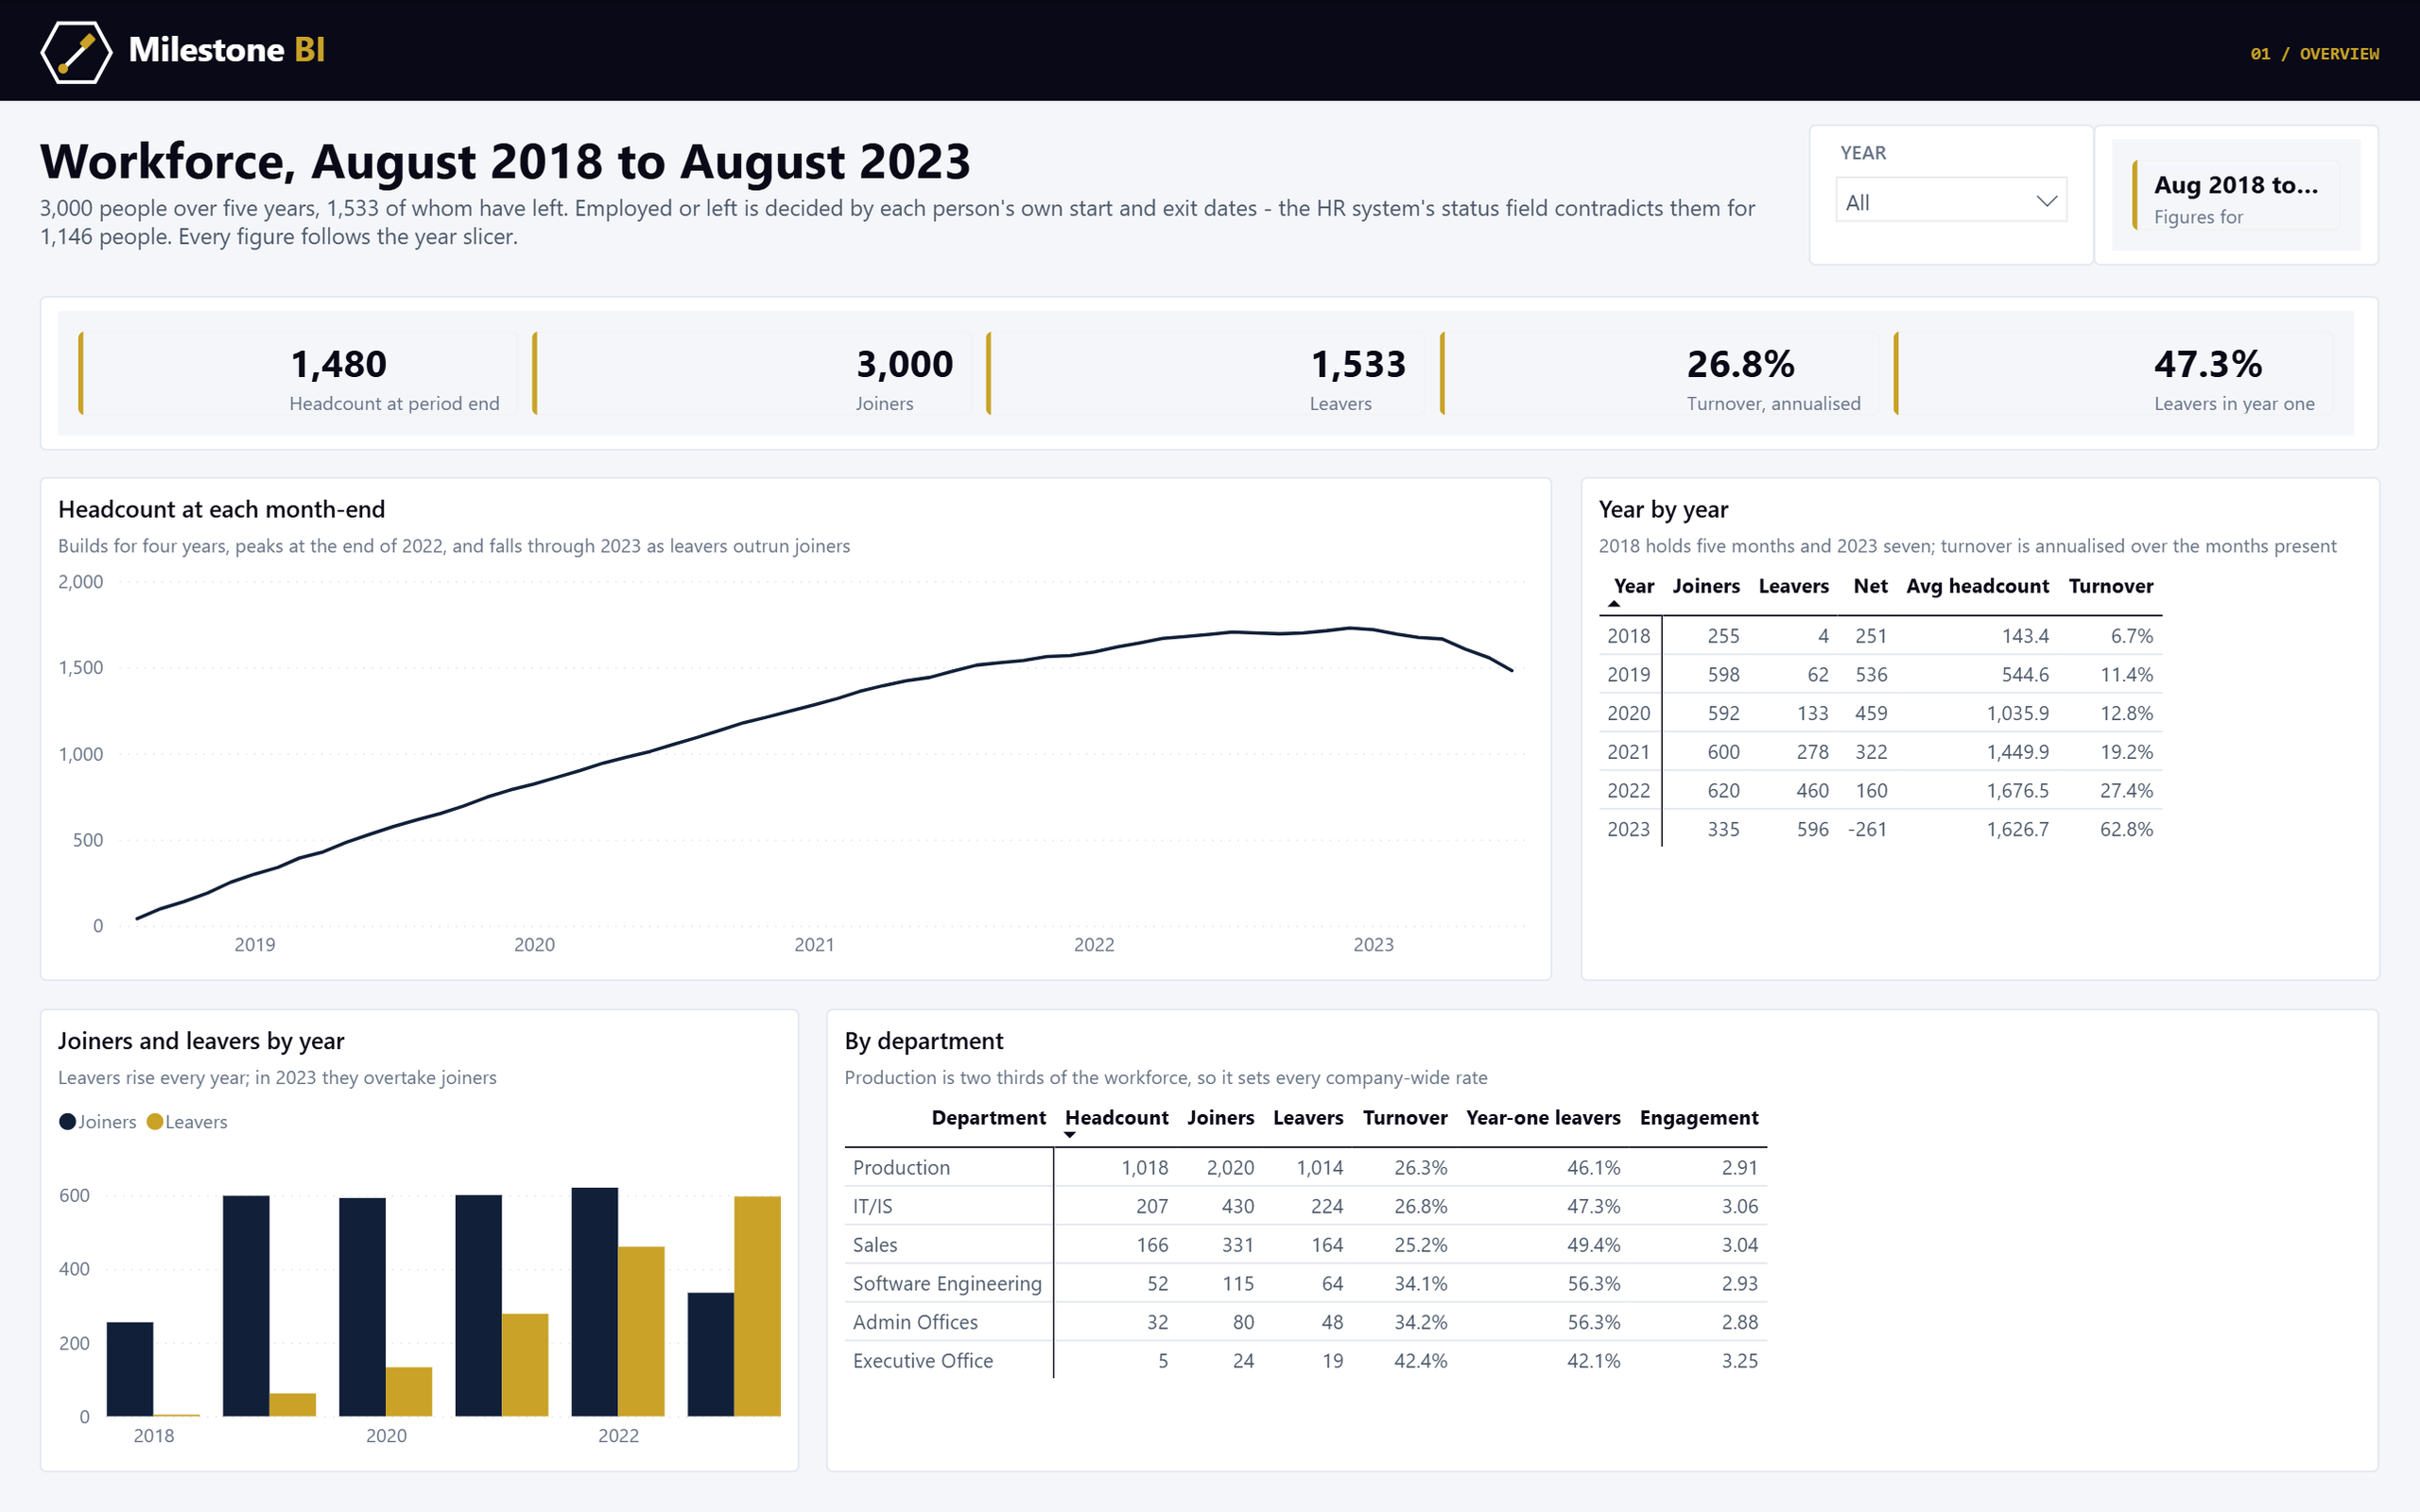
Five years of HR records: headcount, turnover, engagement and training. The HR system’s status field contradicts people’s own dates 1,146 times, and 44% of training spend sits against people who did not work there.
Explore the data →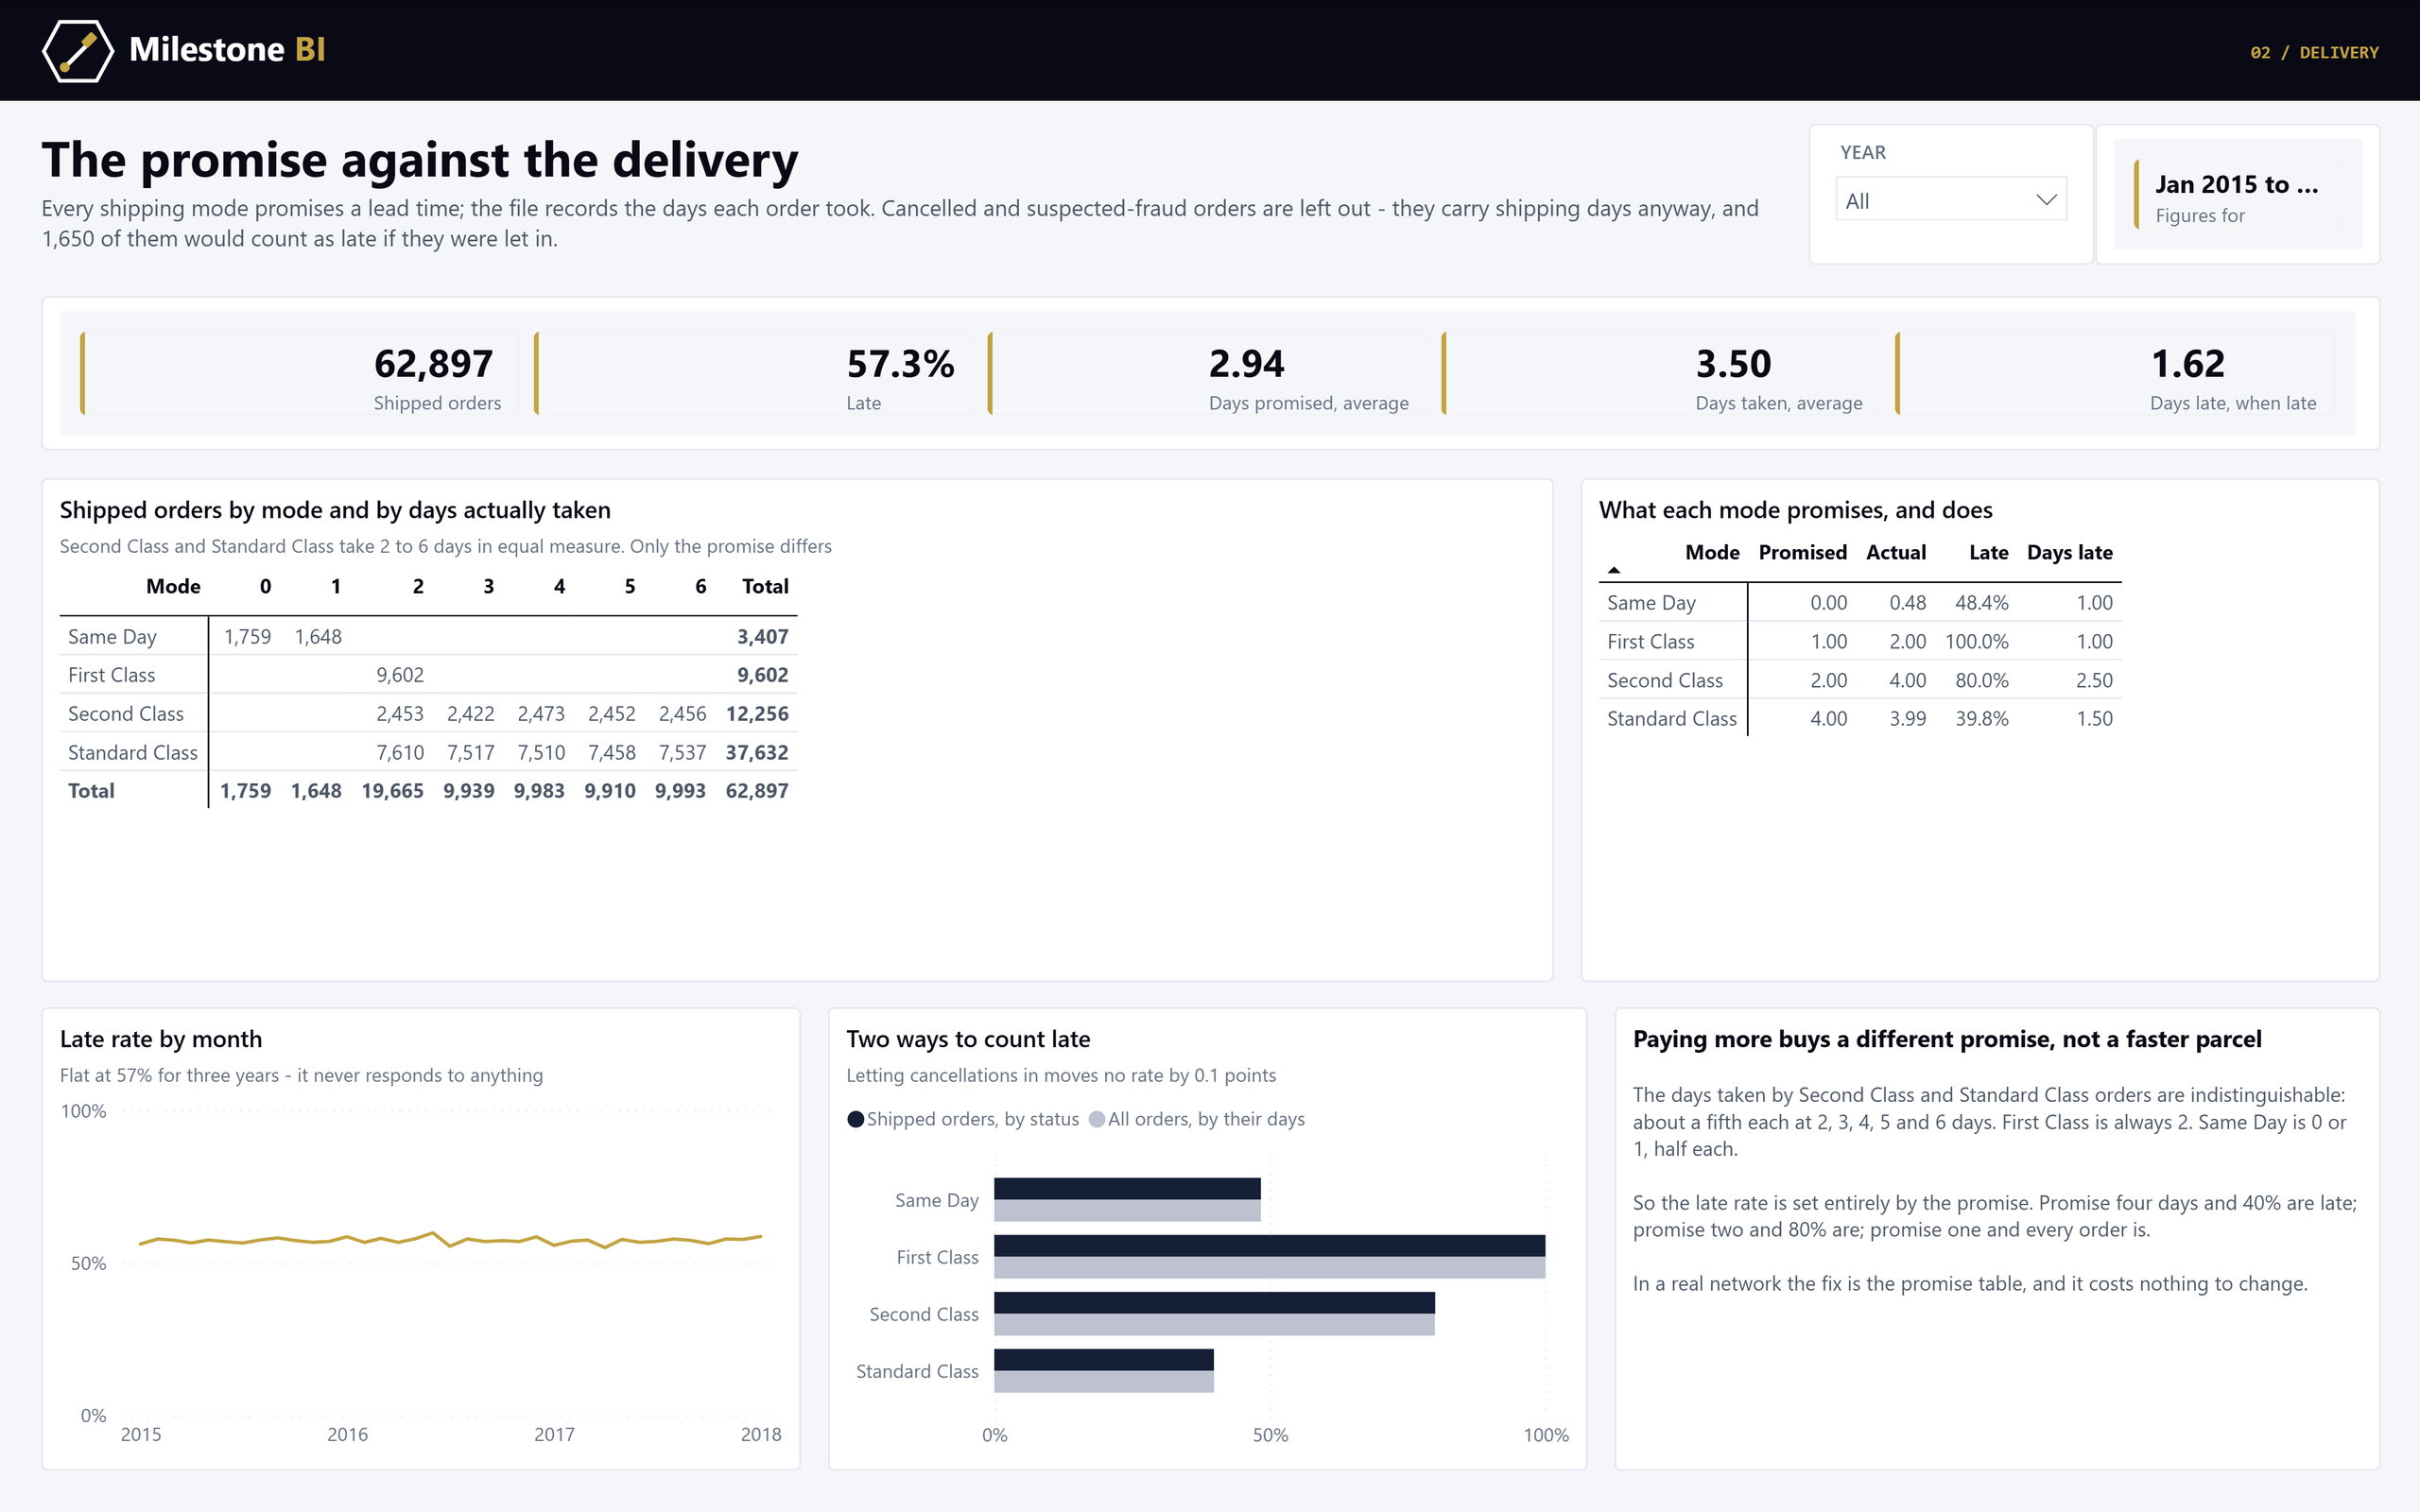
Three years of a retailer’s orders against the lead time each shipping mode promises. First Class is late on every order, and the mode that costs more delivers no faster — only the promise differs.
Explore the data →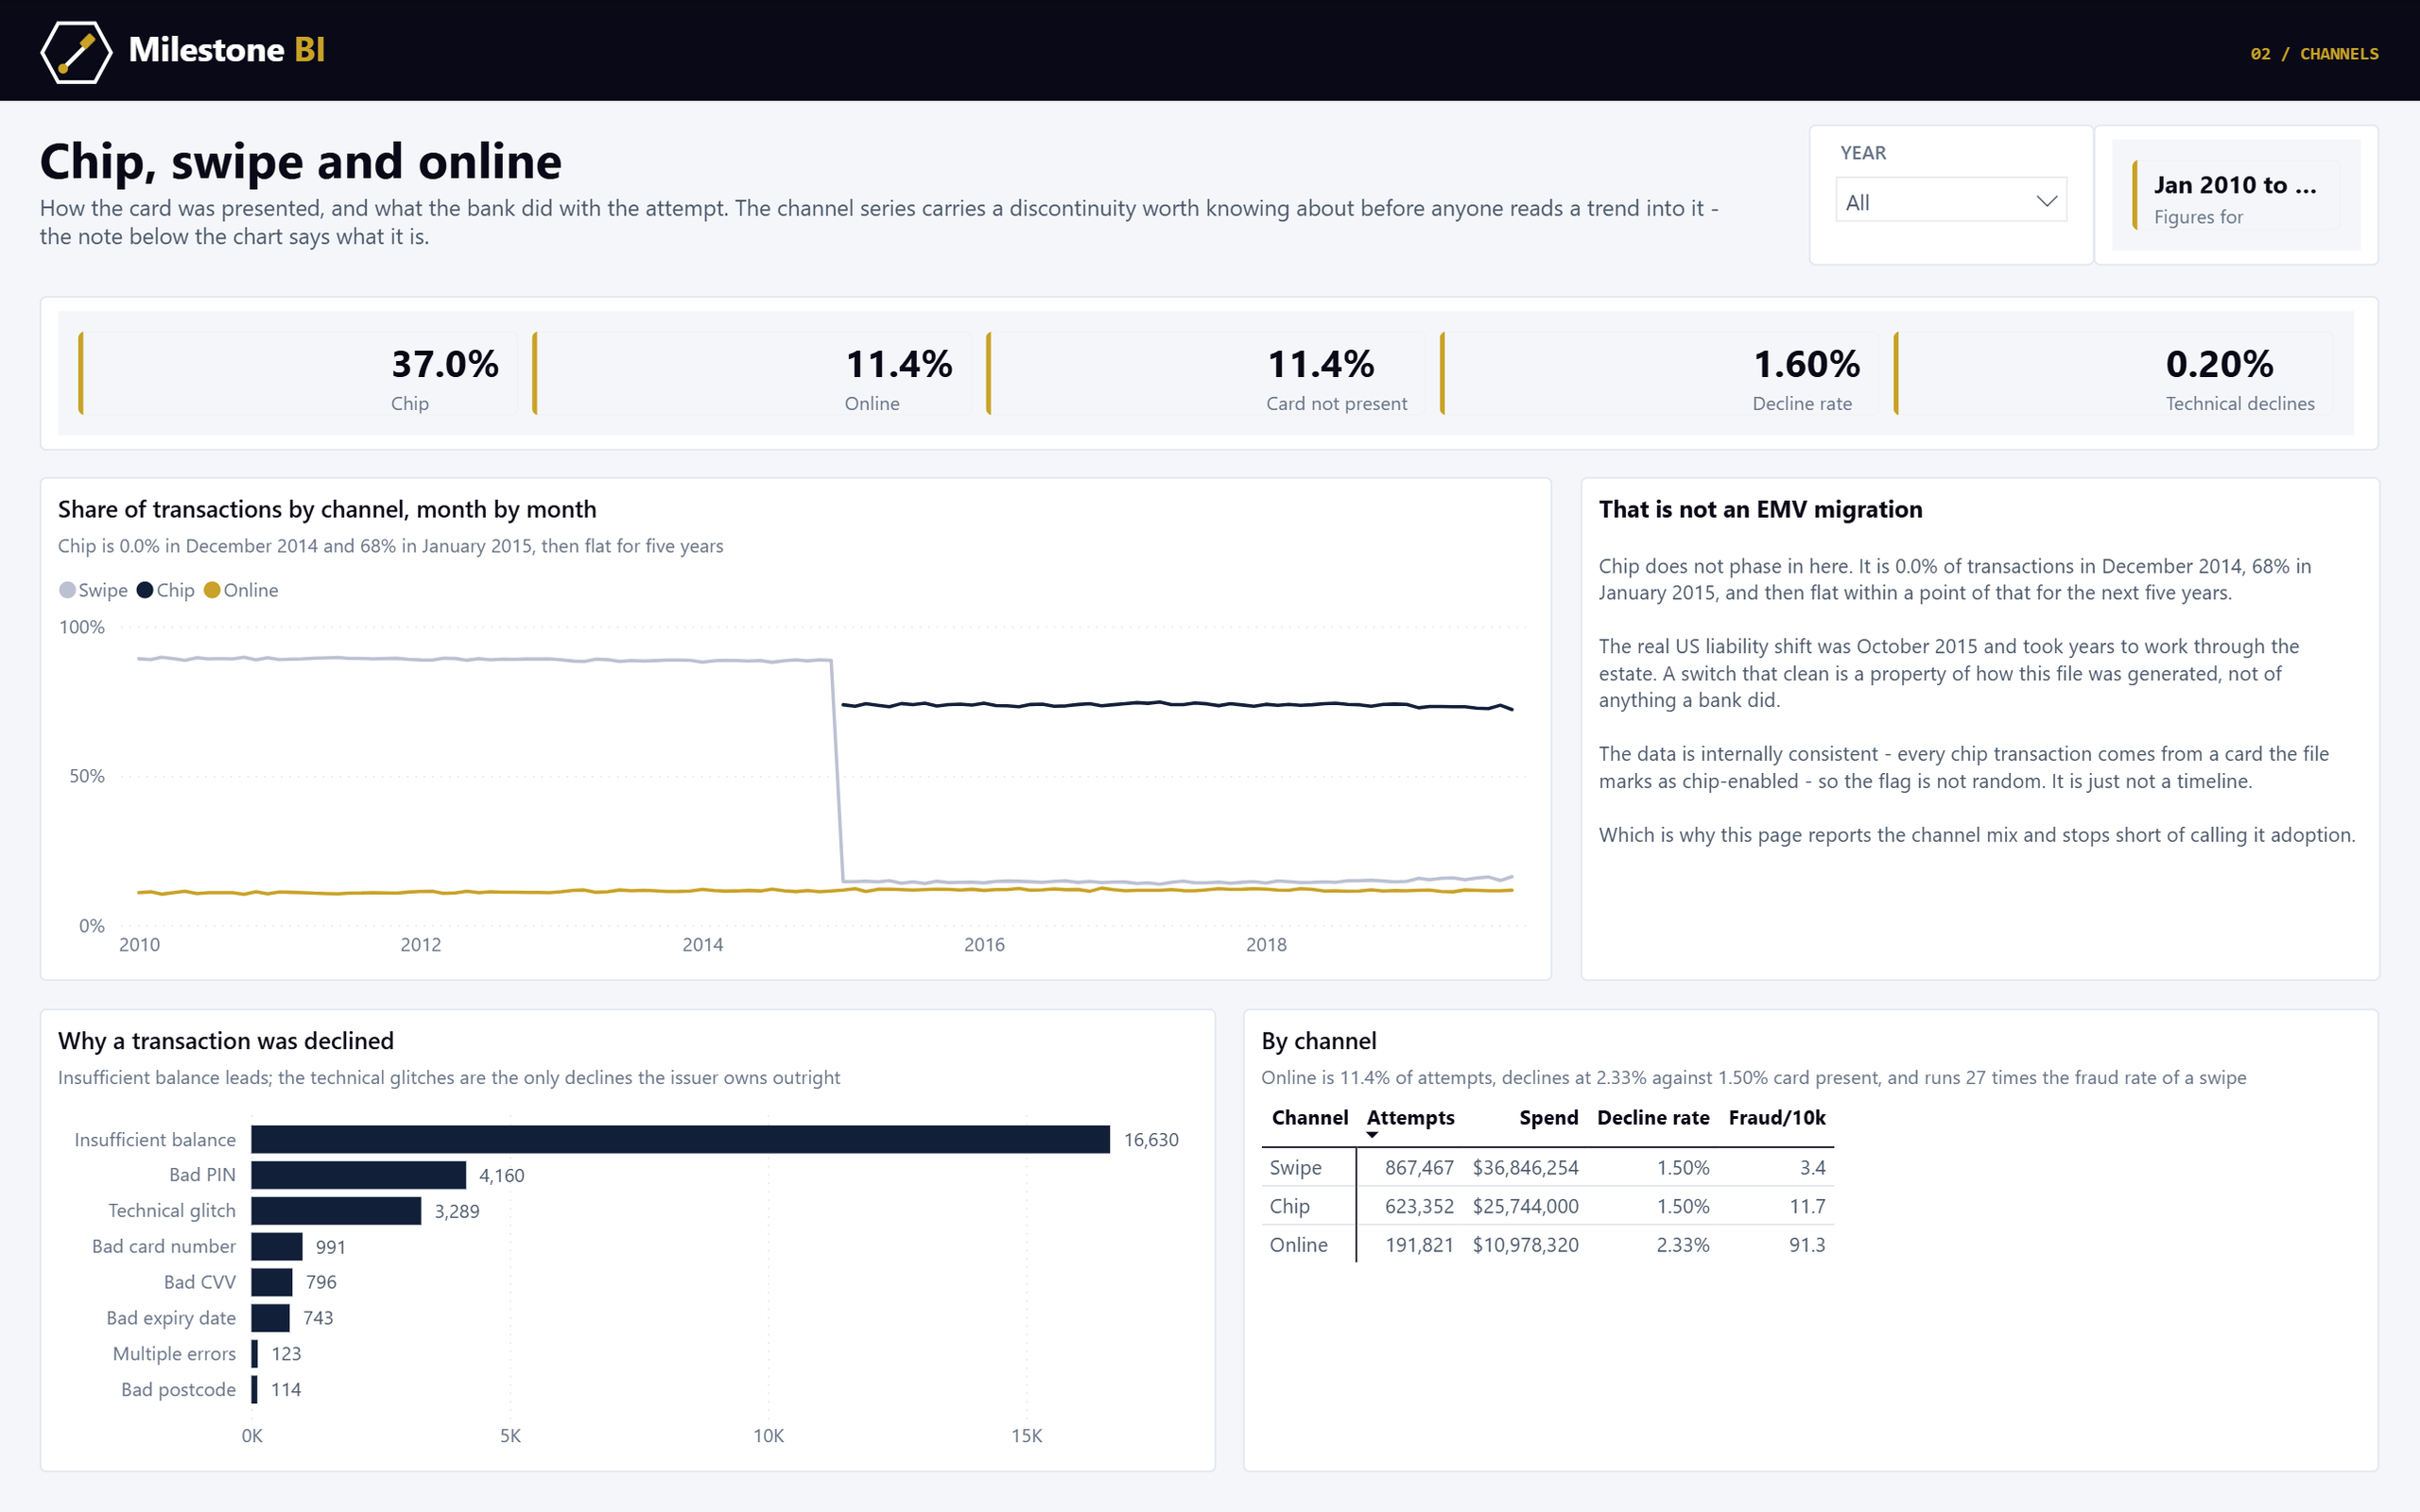
A decade of a bank’s card book: 1.7m transactions, what was declined, and what turned out to be fraud. Two thirds of the file is adjudicated and the rest is not, so the obvious way to compute the fraud rate is wrong by a third — the report shows both denominators.
Explore the data →Turns a Power BI workspace export into a governance audit in seconds: over-privileged access, admin hygiene gaps and orphaned workspaces, flagged and explained.
Open Pulse →The value isn’t in having more data. It’s in knowing exactly what to do with it. Milestone BI point of view