Work you can open

Not screenshots of claims.

Client work sits behind NDAs, so here are seven things you can inspect end to end: six Power BI builds, each mapped to a sector I have worked in, with their models, measures and data-quality work in public — one of them measured against a deliberately bad version of itself — and one product you can run against your own tenant export.

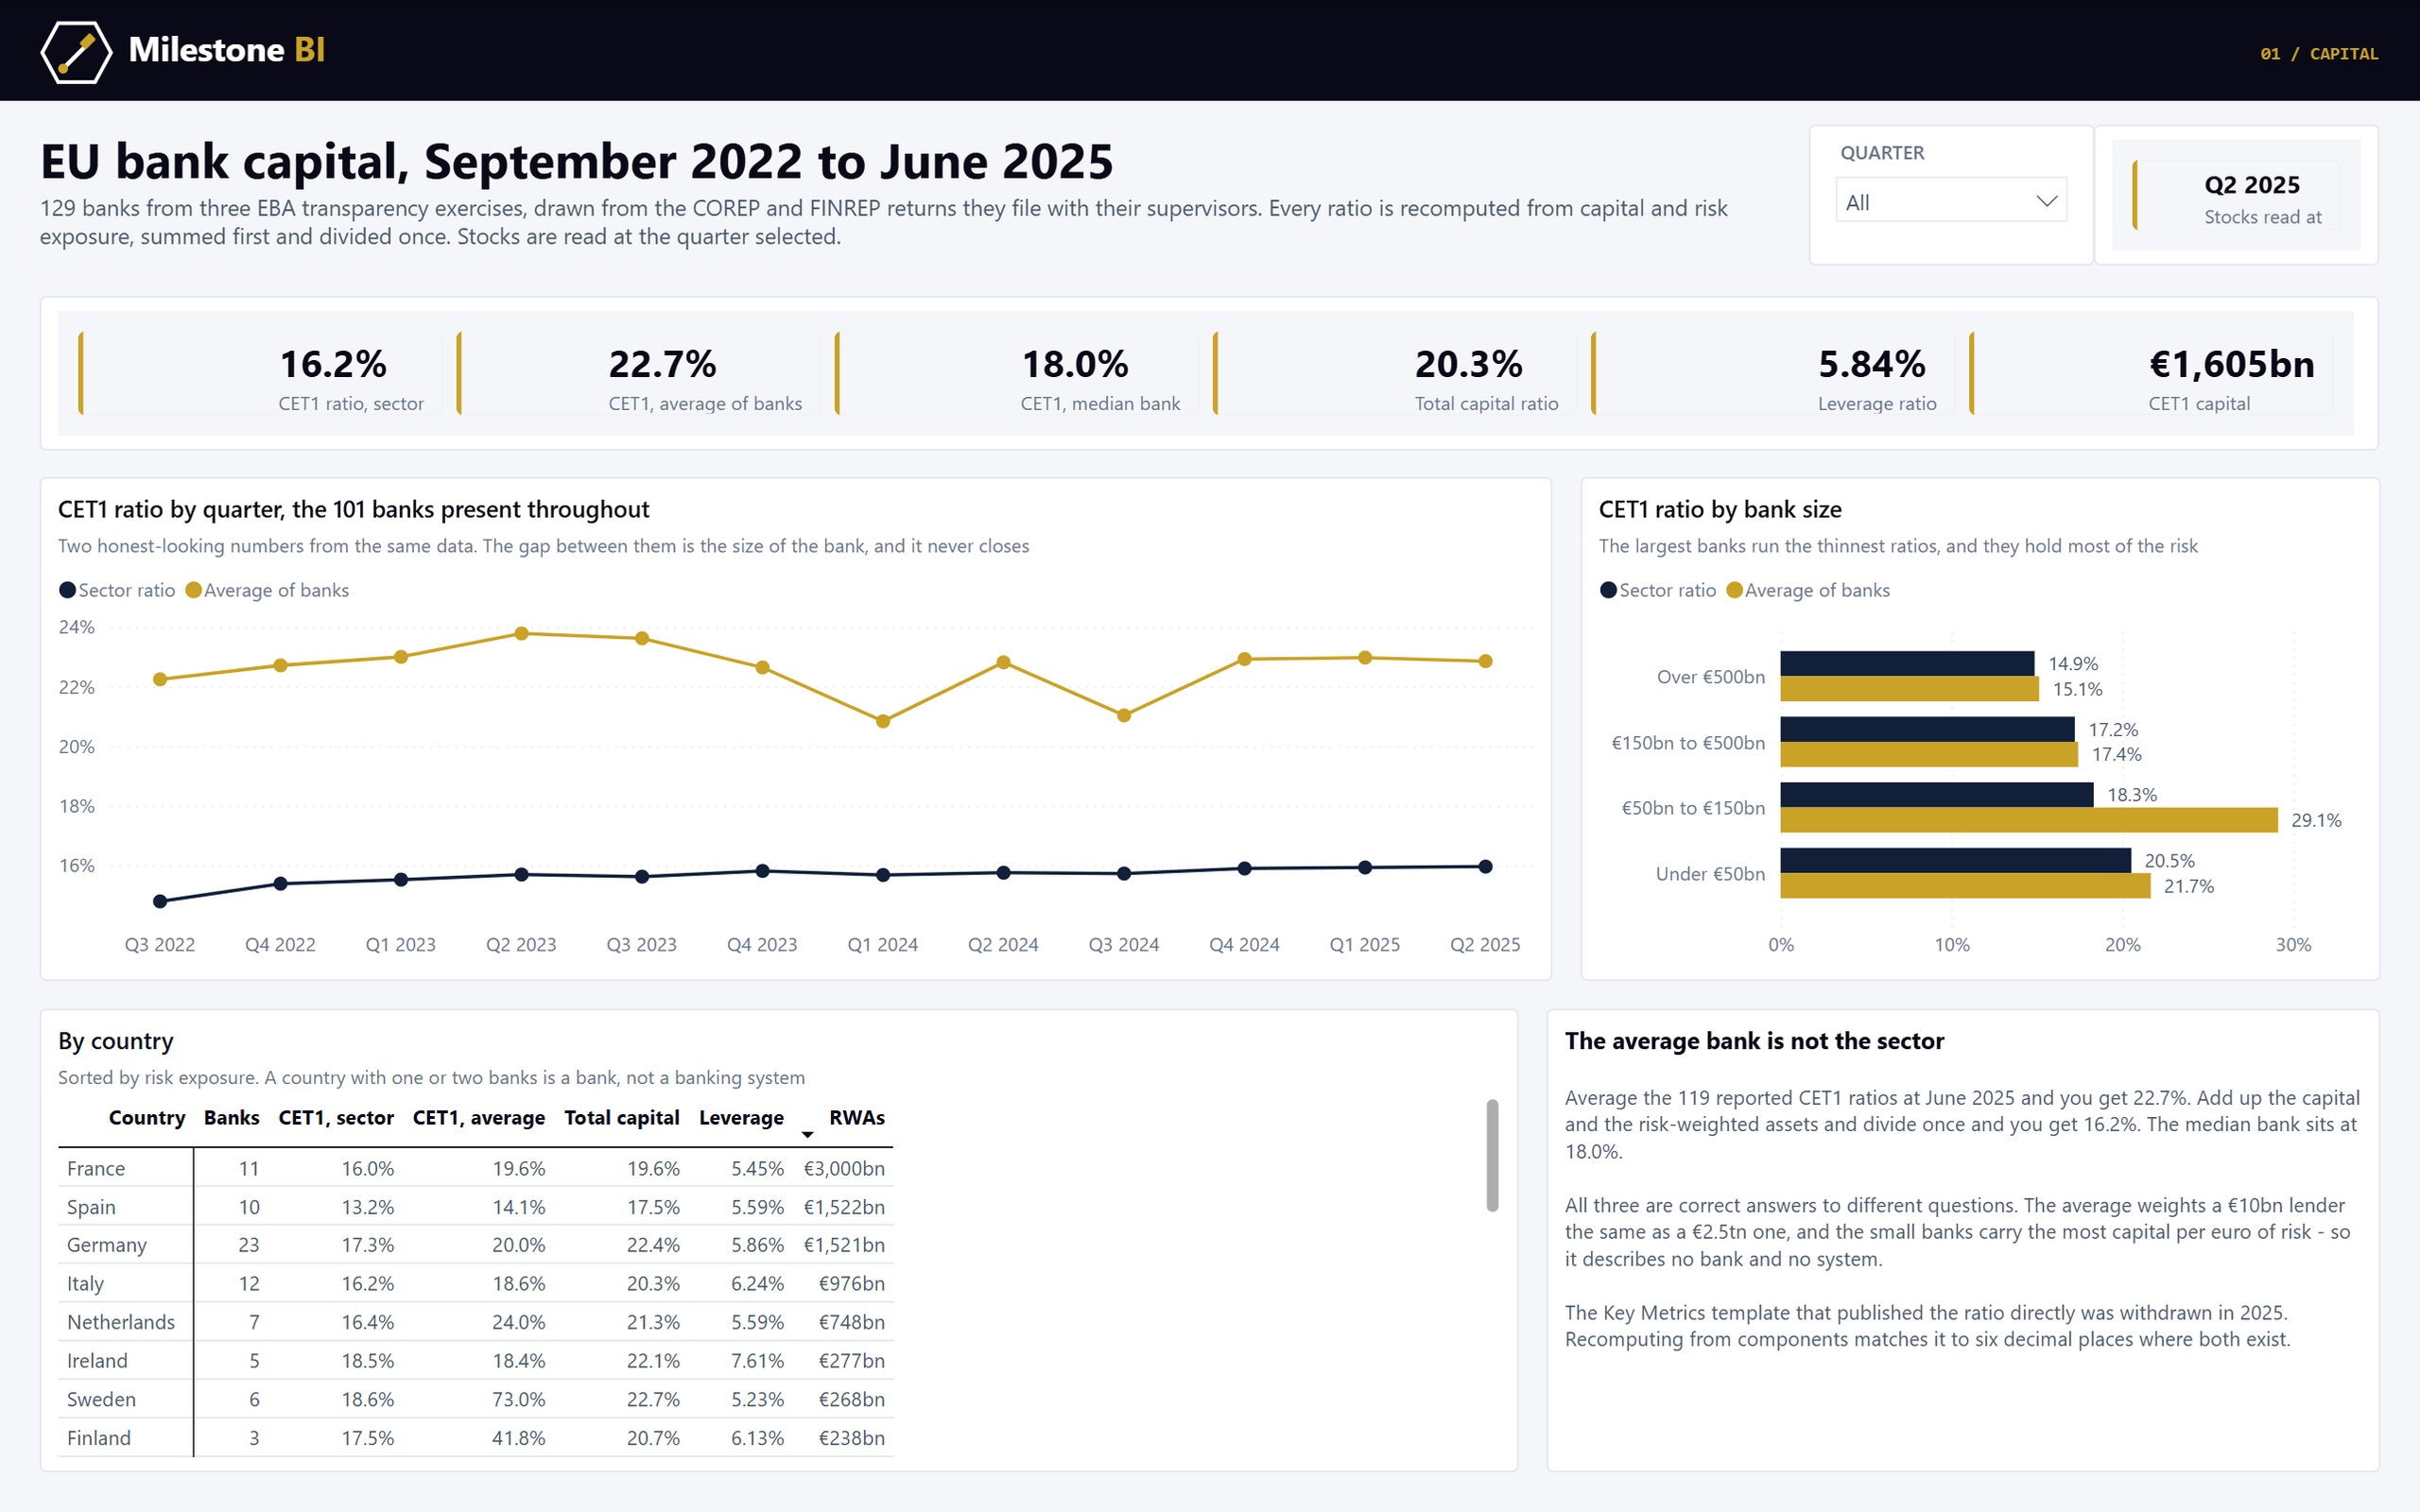
A Power BI report on EU bank capital from the EBA transparency exercise, showing the sector CET1 ratio against the average and median of banks, a quarterly trend of the sector ratio against the average of banks on a constant panel, CET1 ratios by bank size, and a table by country.
POWER BI · REGULATORY REPORTING

EU bank capital

Three years of the COREP and FINREP returns 129 EU banks file with their supervisors. The sector’s CET1 ratio is 16.2%; average the banks’ own ratios and you get 22.7%. Every ratio is recomputed from its components, every item code mapped across three renumbered exercises, and the year-to-date P&L taken apart bank by bank.

Power BI · TMDL · DAX · Python · COREP / FINREP · Data quality

Explore the data
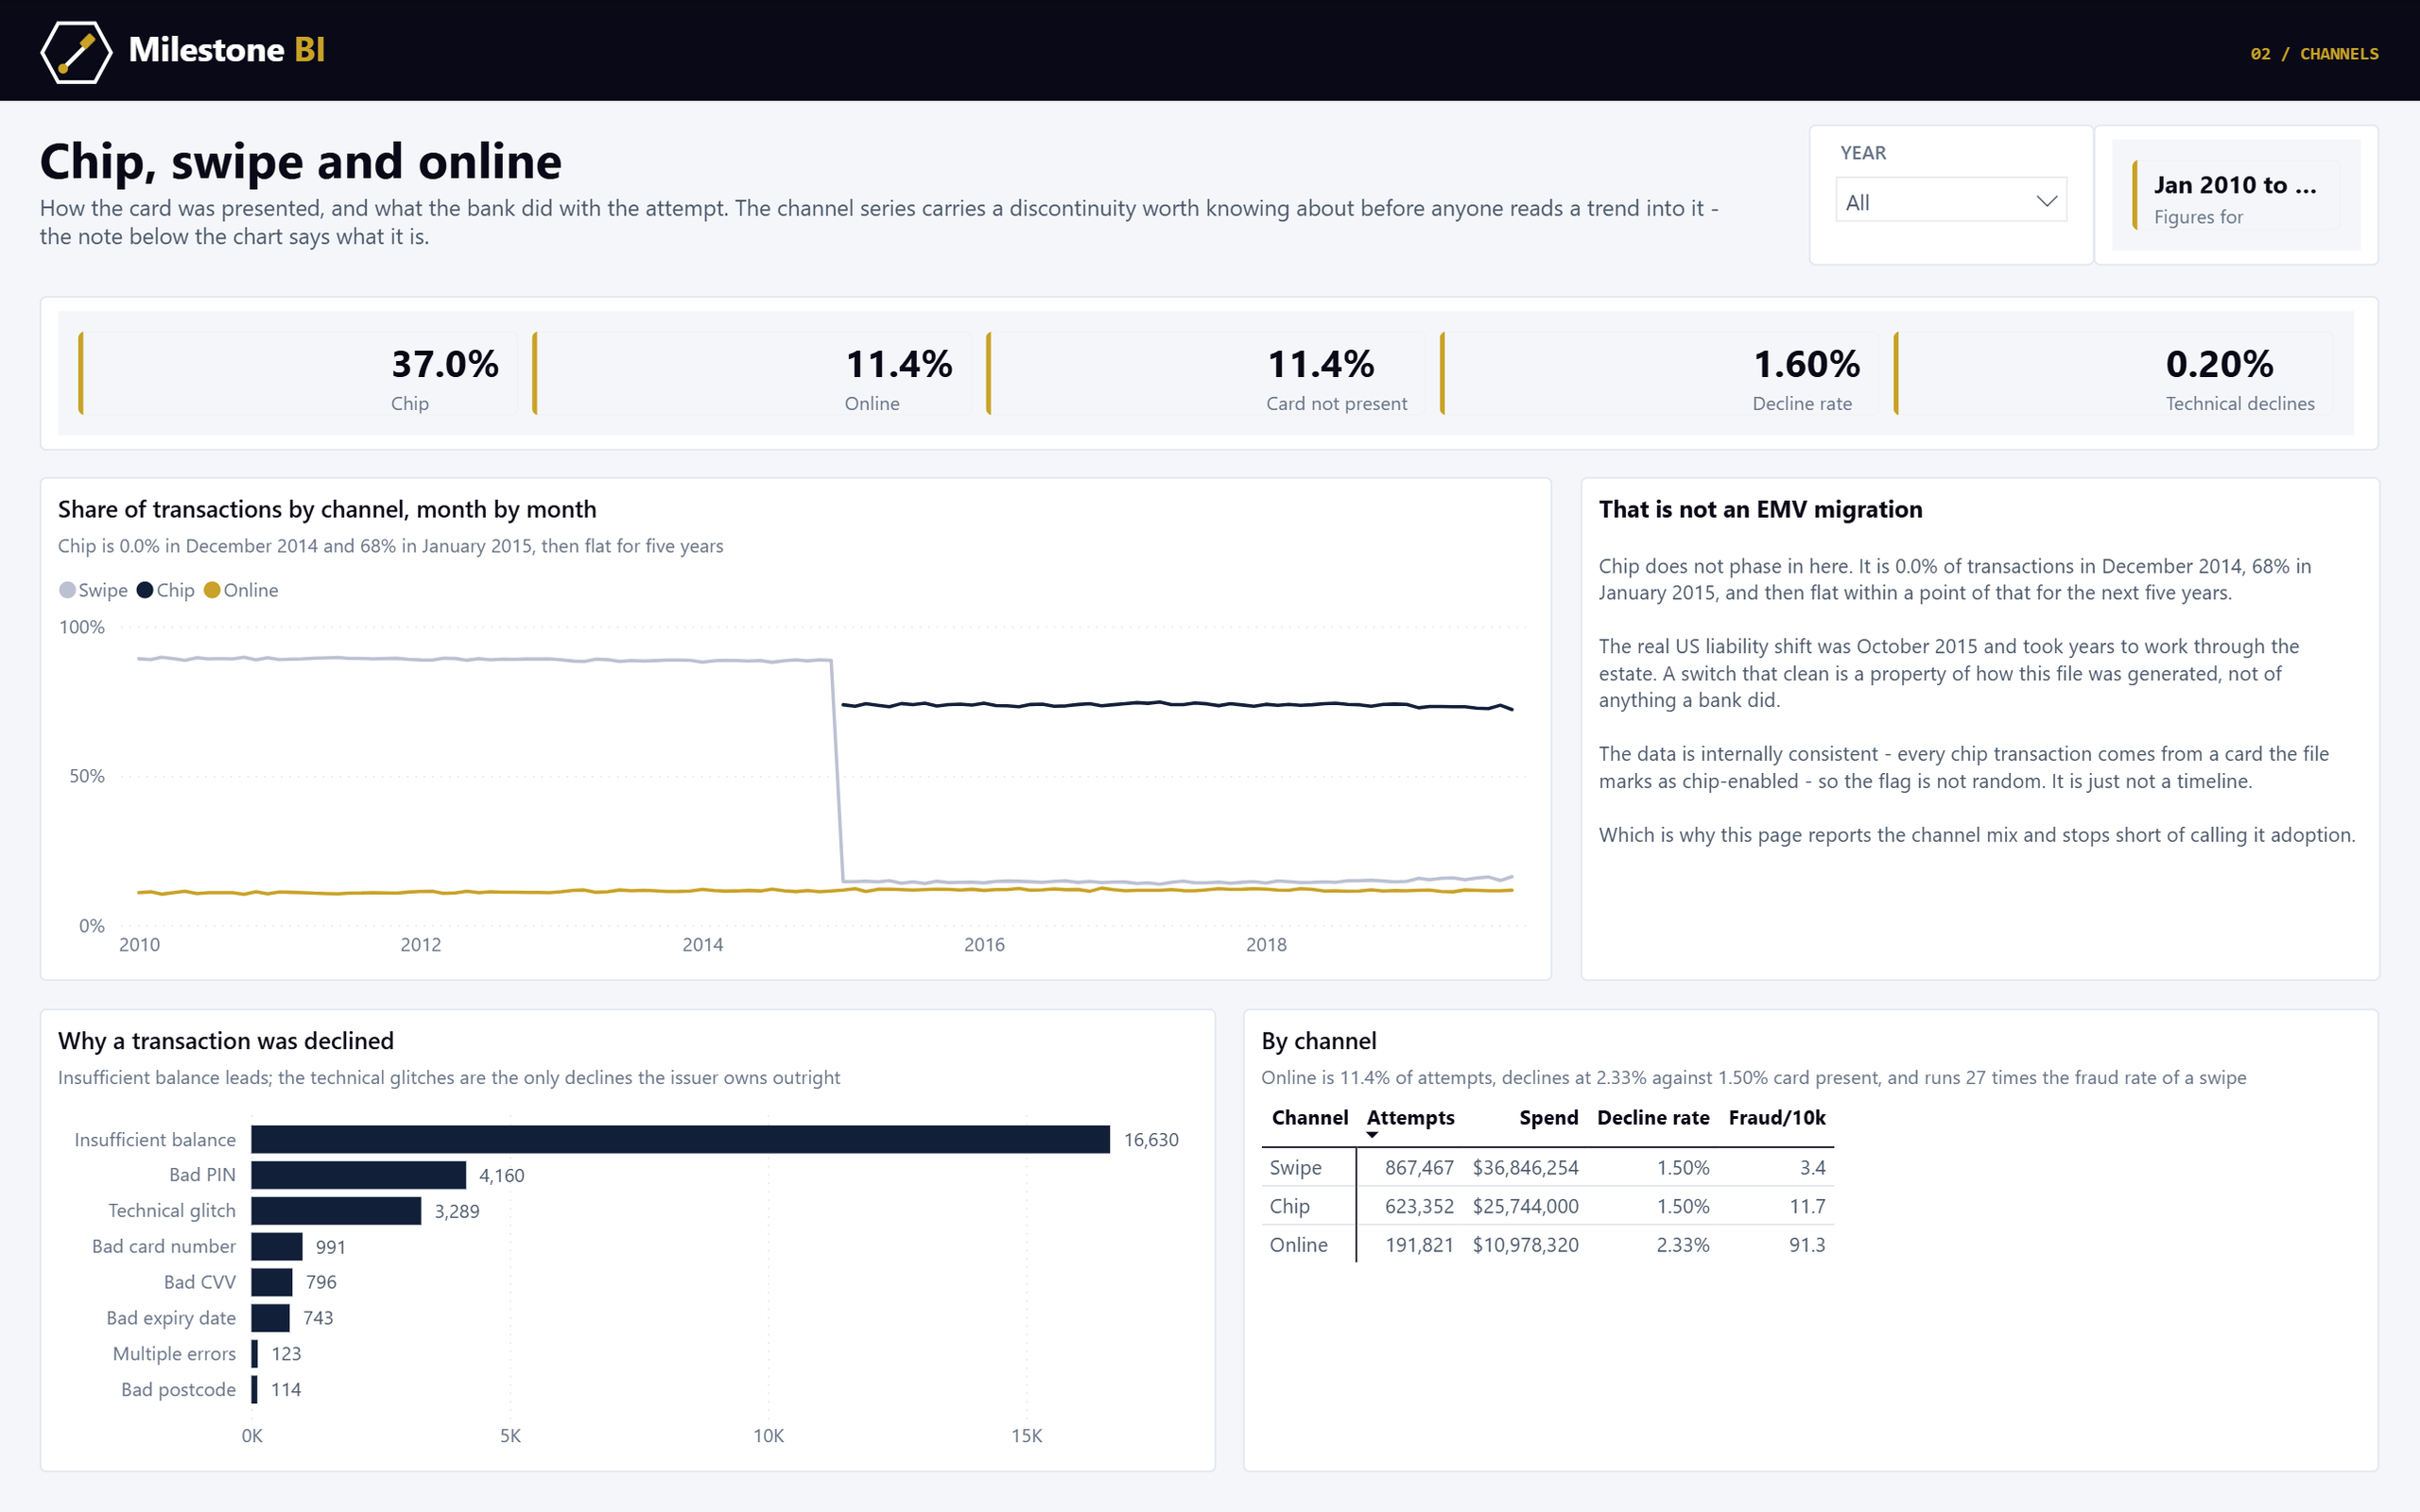
A Power BI report on a decade of US card transactions, showing the share of transactions by channel month by month with chip jumping from zero to 68 per cent in January 2015, a note explaining why that is not an EMV migration, declines by reason, and a table of attempts, spend, decline rate and fraud per 10,000 by channel.
POWER BI · OPEN SOURCE

Card transactions & fraud

A decade of a bank’s card book: 1.7m transactions, what was declined, and what turned out to be fraud. Two thirds of the file is adjudicated and the rest is not, so the obvious way to compute the fraud rate is wrong by a third — the report shows both denominators. The same rows are then modelled a second time, badly, and measured against this one.

Power BI · TMDL · DAX · Python · VertiPaq · Data quality

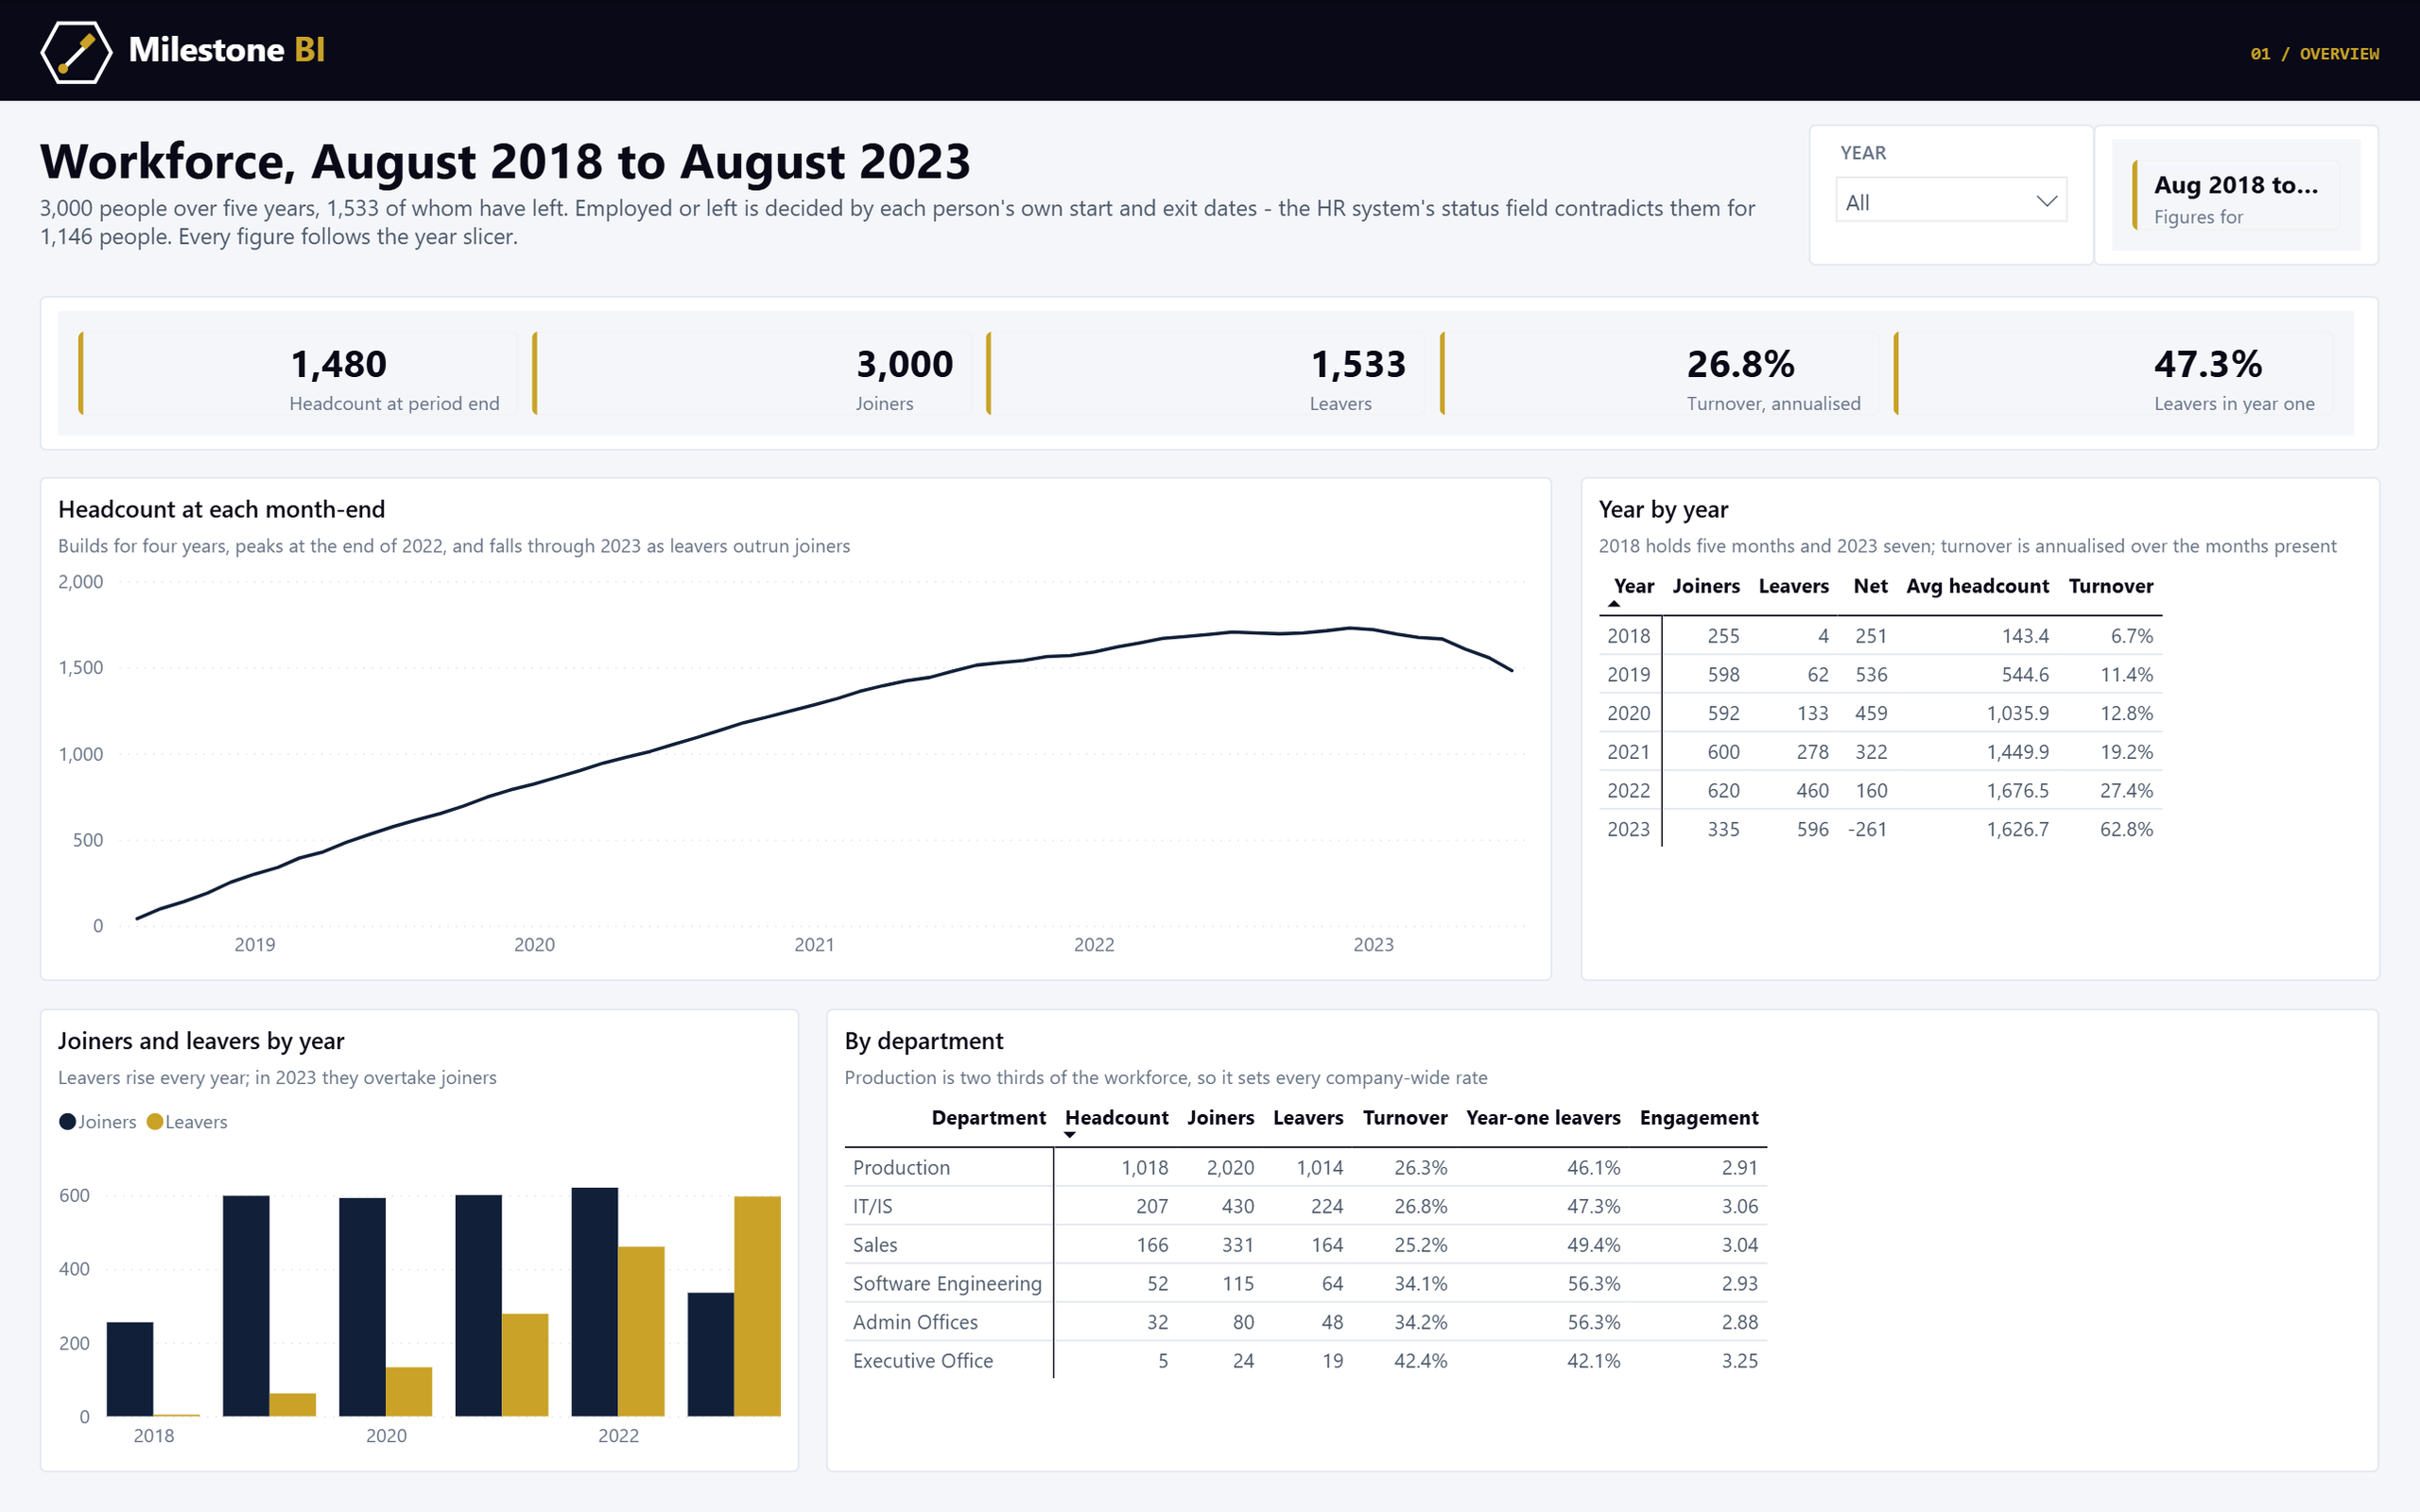
A Power BI report on five years of workforce data, showing headcount at period end, joiners, leavers, annualised turnover and the share leaving in year one, a line of month-end headcount peaking at the end of 2022, a year-by-year table with turnover rising to 62.8%, joiners and leavers by year, and a department table.
POWER BI · HR ANALYTICS

Workforce analytics

Five years of HR records: headcount, turnover, engagement and training. The HR system’s status field contradicts people’s own dates 1,146 times, the recruitment file turns out to belong to someone else, and 44% of training spend is booked against people who did not work there.

Power BI · TMDL · DAX · Python · Data quality

Explore the data
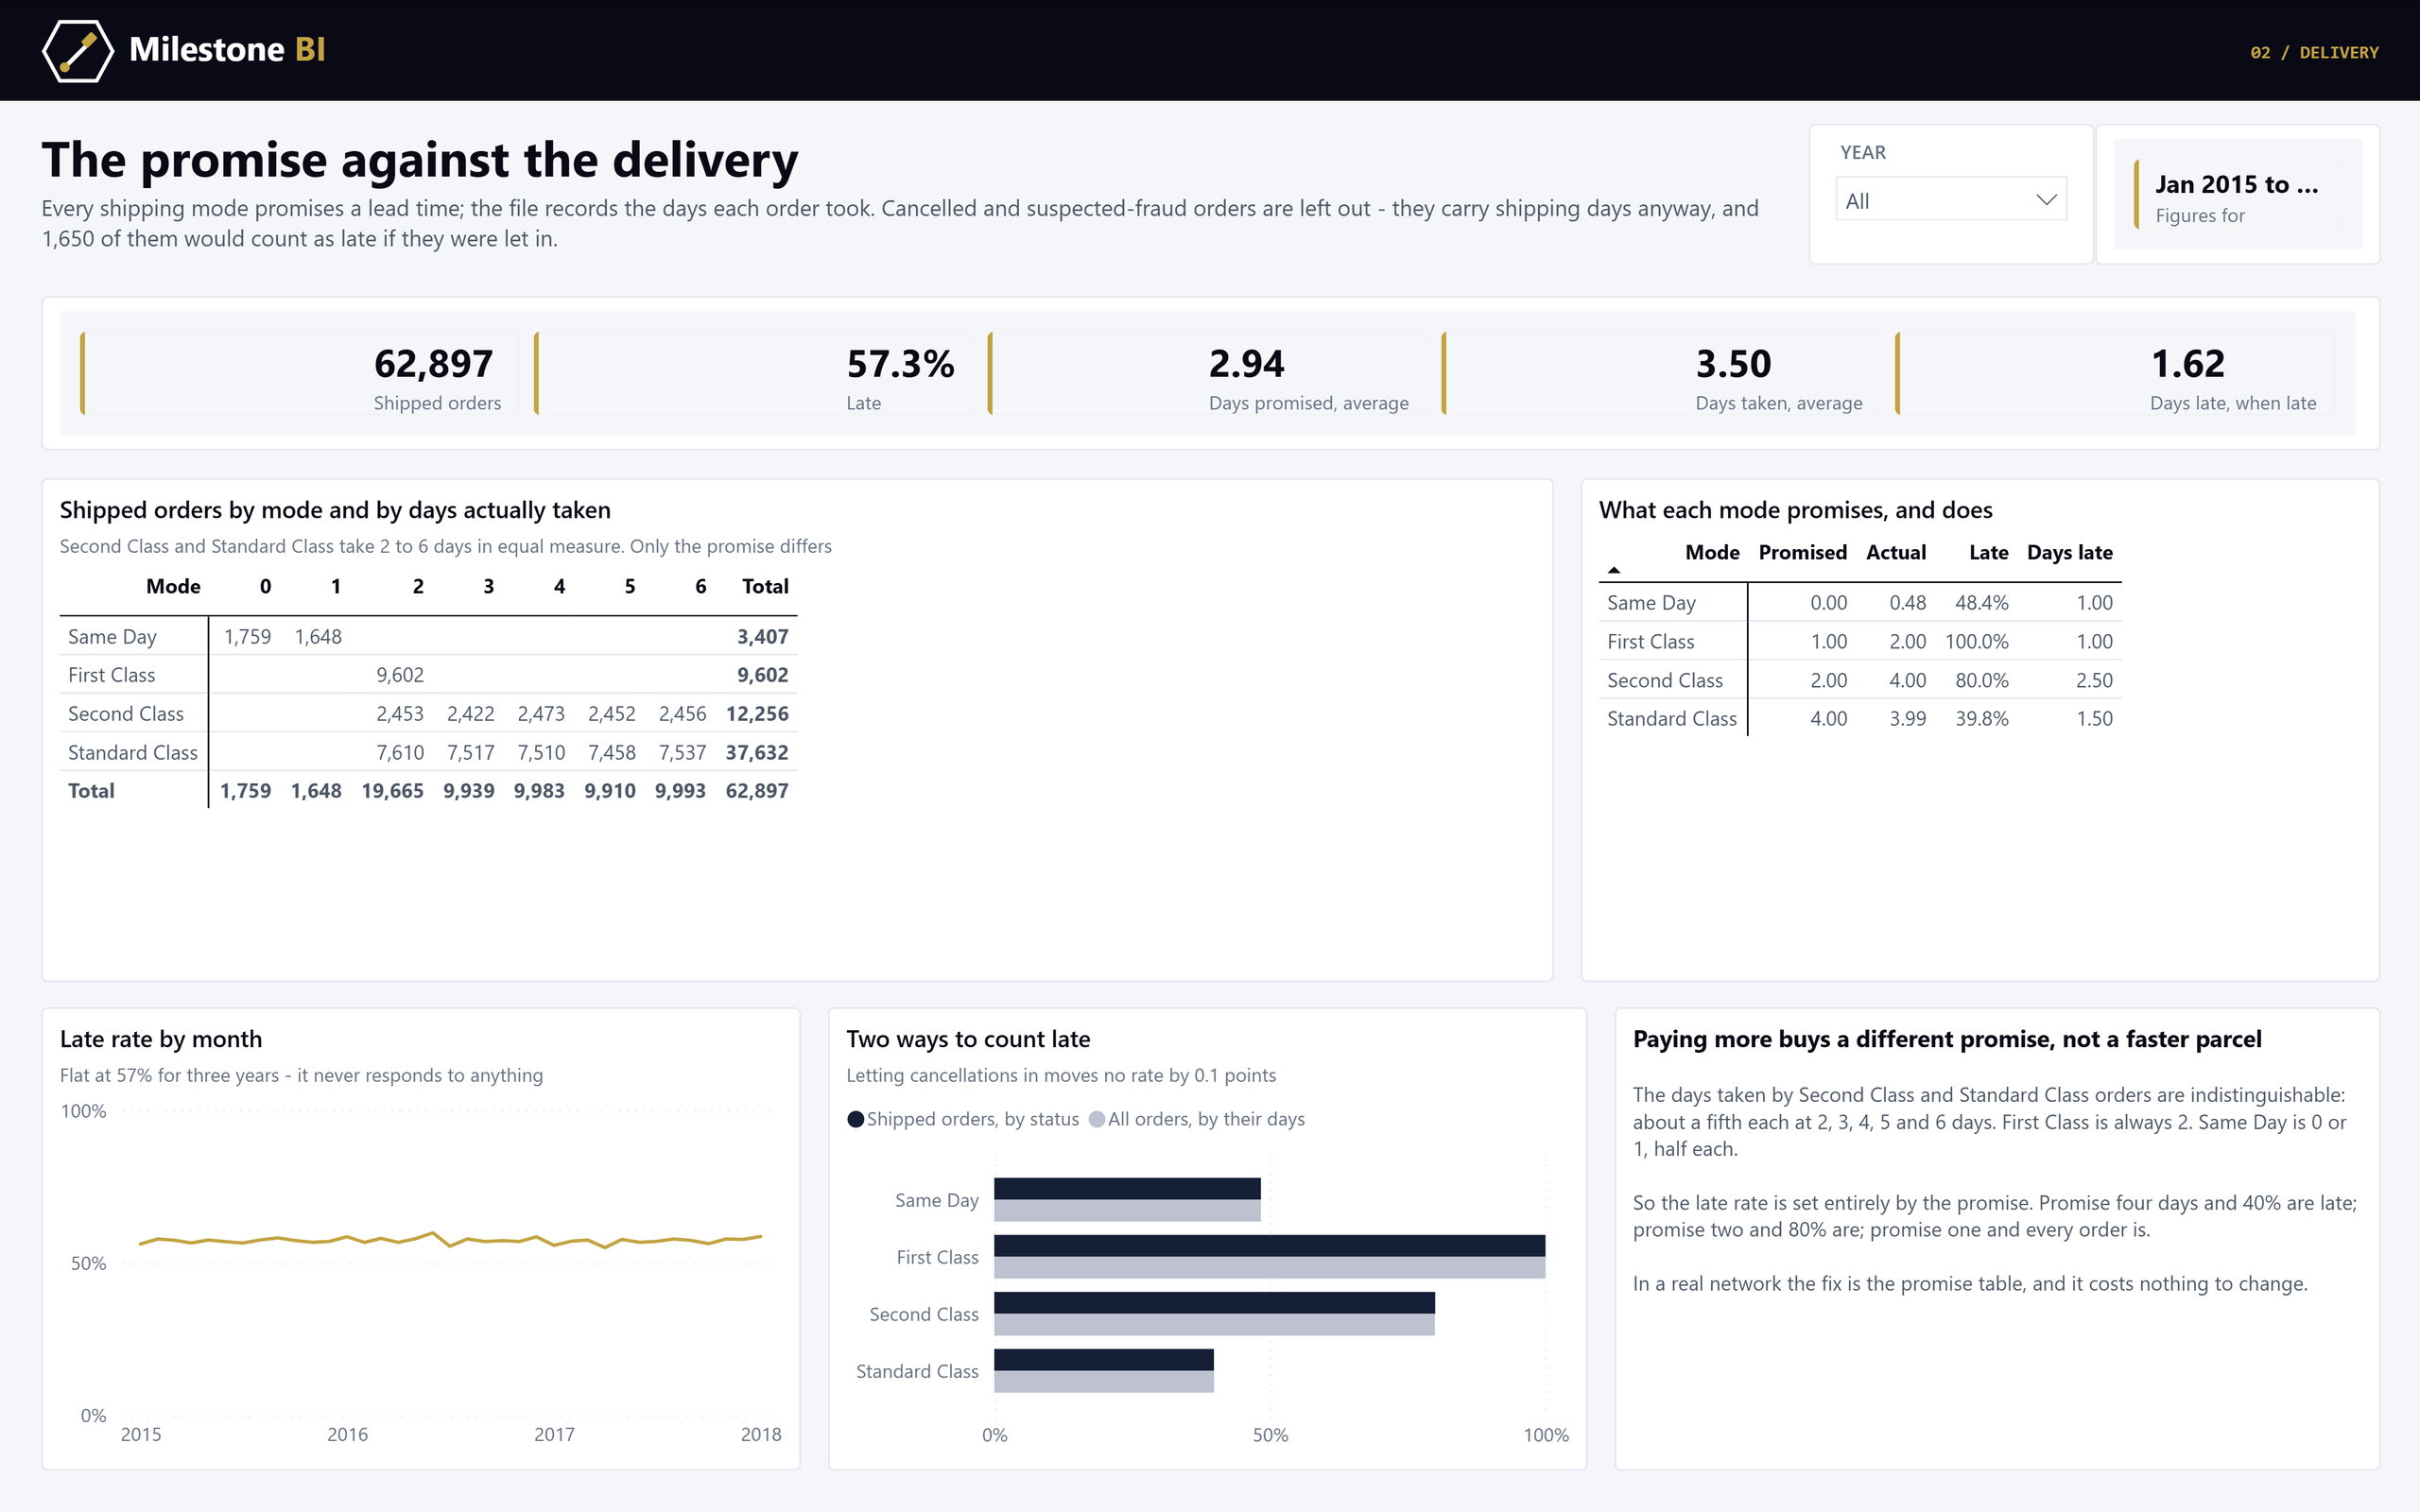
A Power BI report on a retailer's delivery performance, showing shipped orders by shipping mode against the days each order actually took, what each mode promises and delivers, the late rate by month, and two ways of counting late orders.
POWER BI · RETAIL & SUPPLY CHAIN

Supply chain delivery

Three years of a retailer’s orders to 164 countries: net sales, margin and delivery against the lead time each shipping mode promises. First Class is late on every order, and the mode that costs more delivers no faster — only the promise differs. The column called Sales isn’t revenue, and the last four months come from a different generator.

Power BI · TMDL · DAX · Python · Supply chain · Data quality

Explore the data
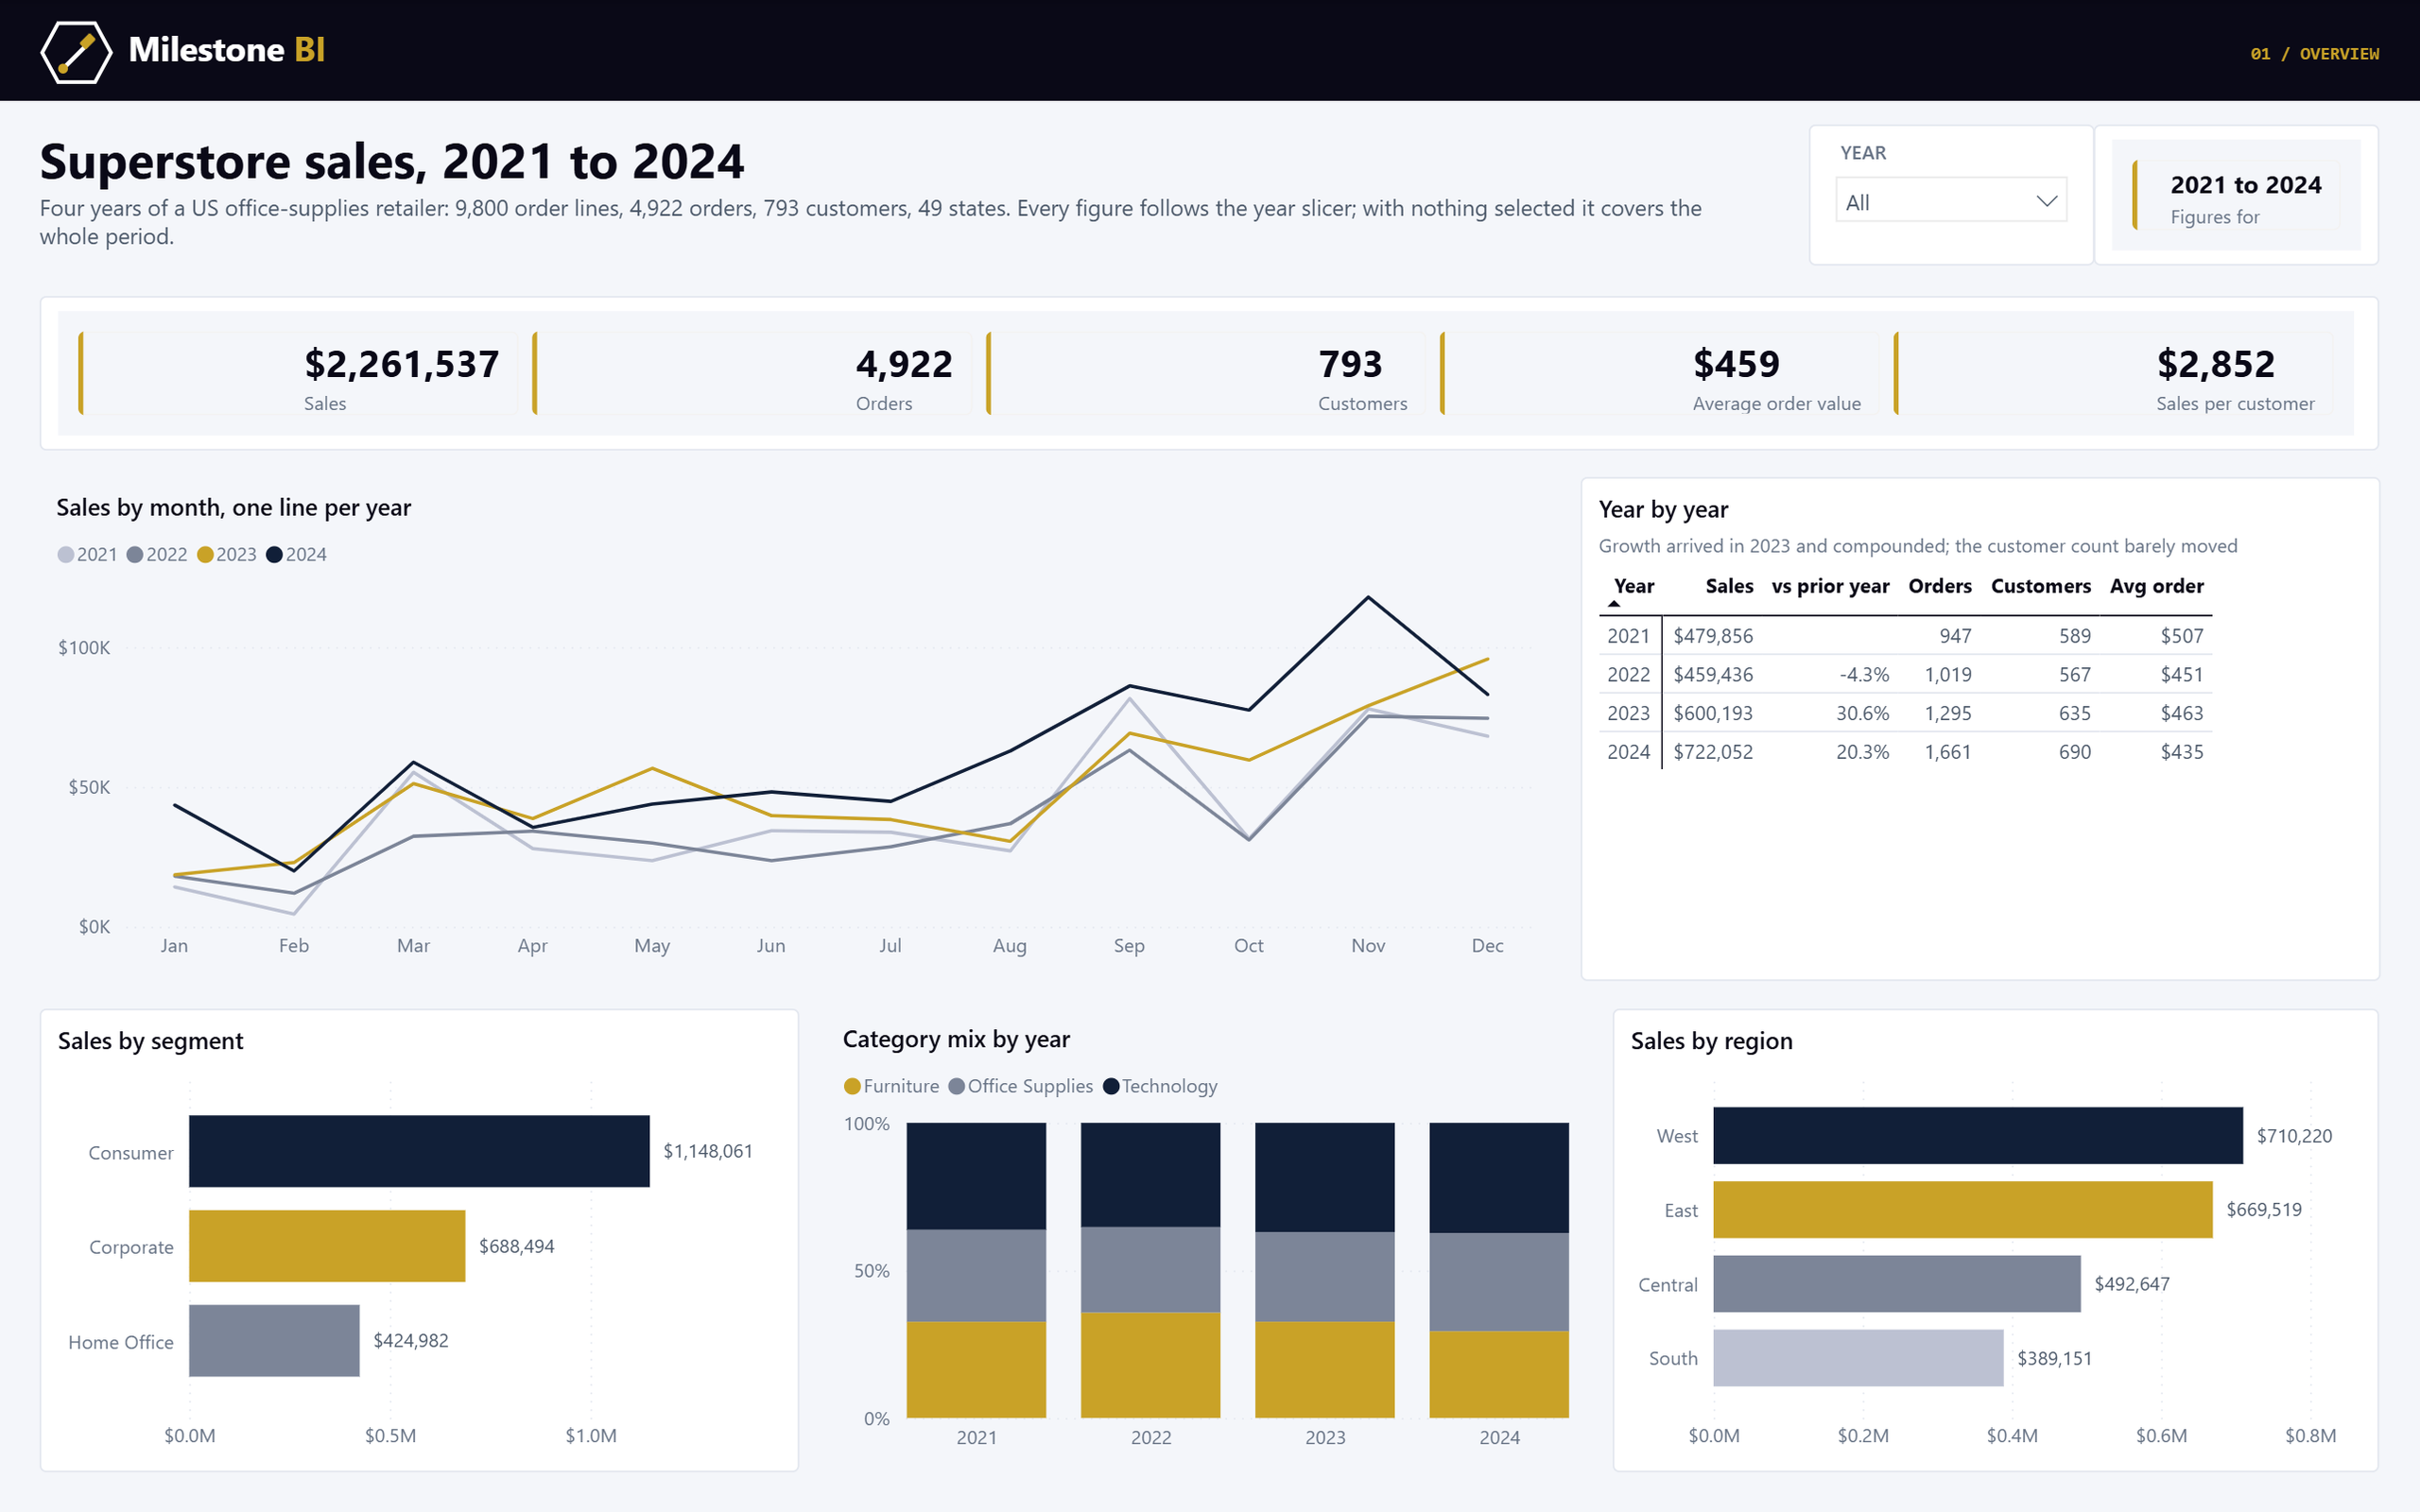
A Power BI report on four years of Superstore sales showing $2,261,537 in sales, 4,922 orders and 793 customers, a line chart of monthly sales with one line per year, a year-by-year table, and sales by segment, category mix and region.
POWER BI · OPEN SOURCE

Superstore sales

Four years of a US retailer’s orders, rebuilt as a star schema whose product key turned out not to be one. 793 customers who almost never leave: retention, not acquisition, is the story, and every measure was checked against pandas before it was drawn.

Power BI · TMDL · DAX · Python · Data quality

Explore the data
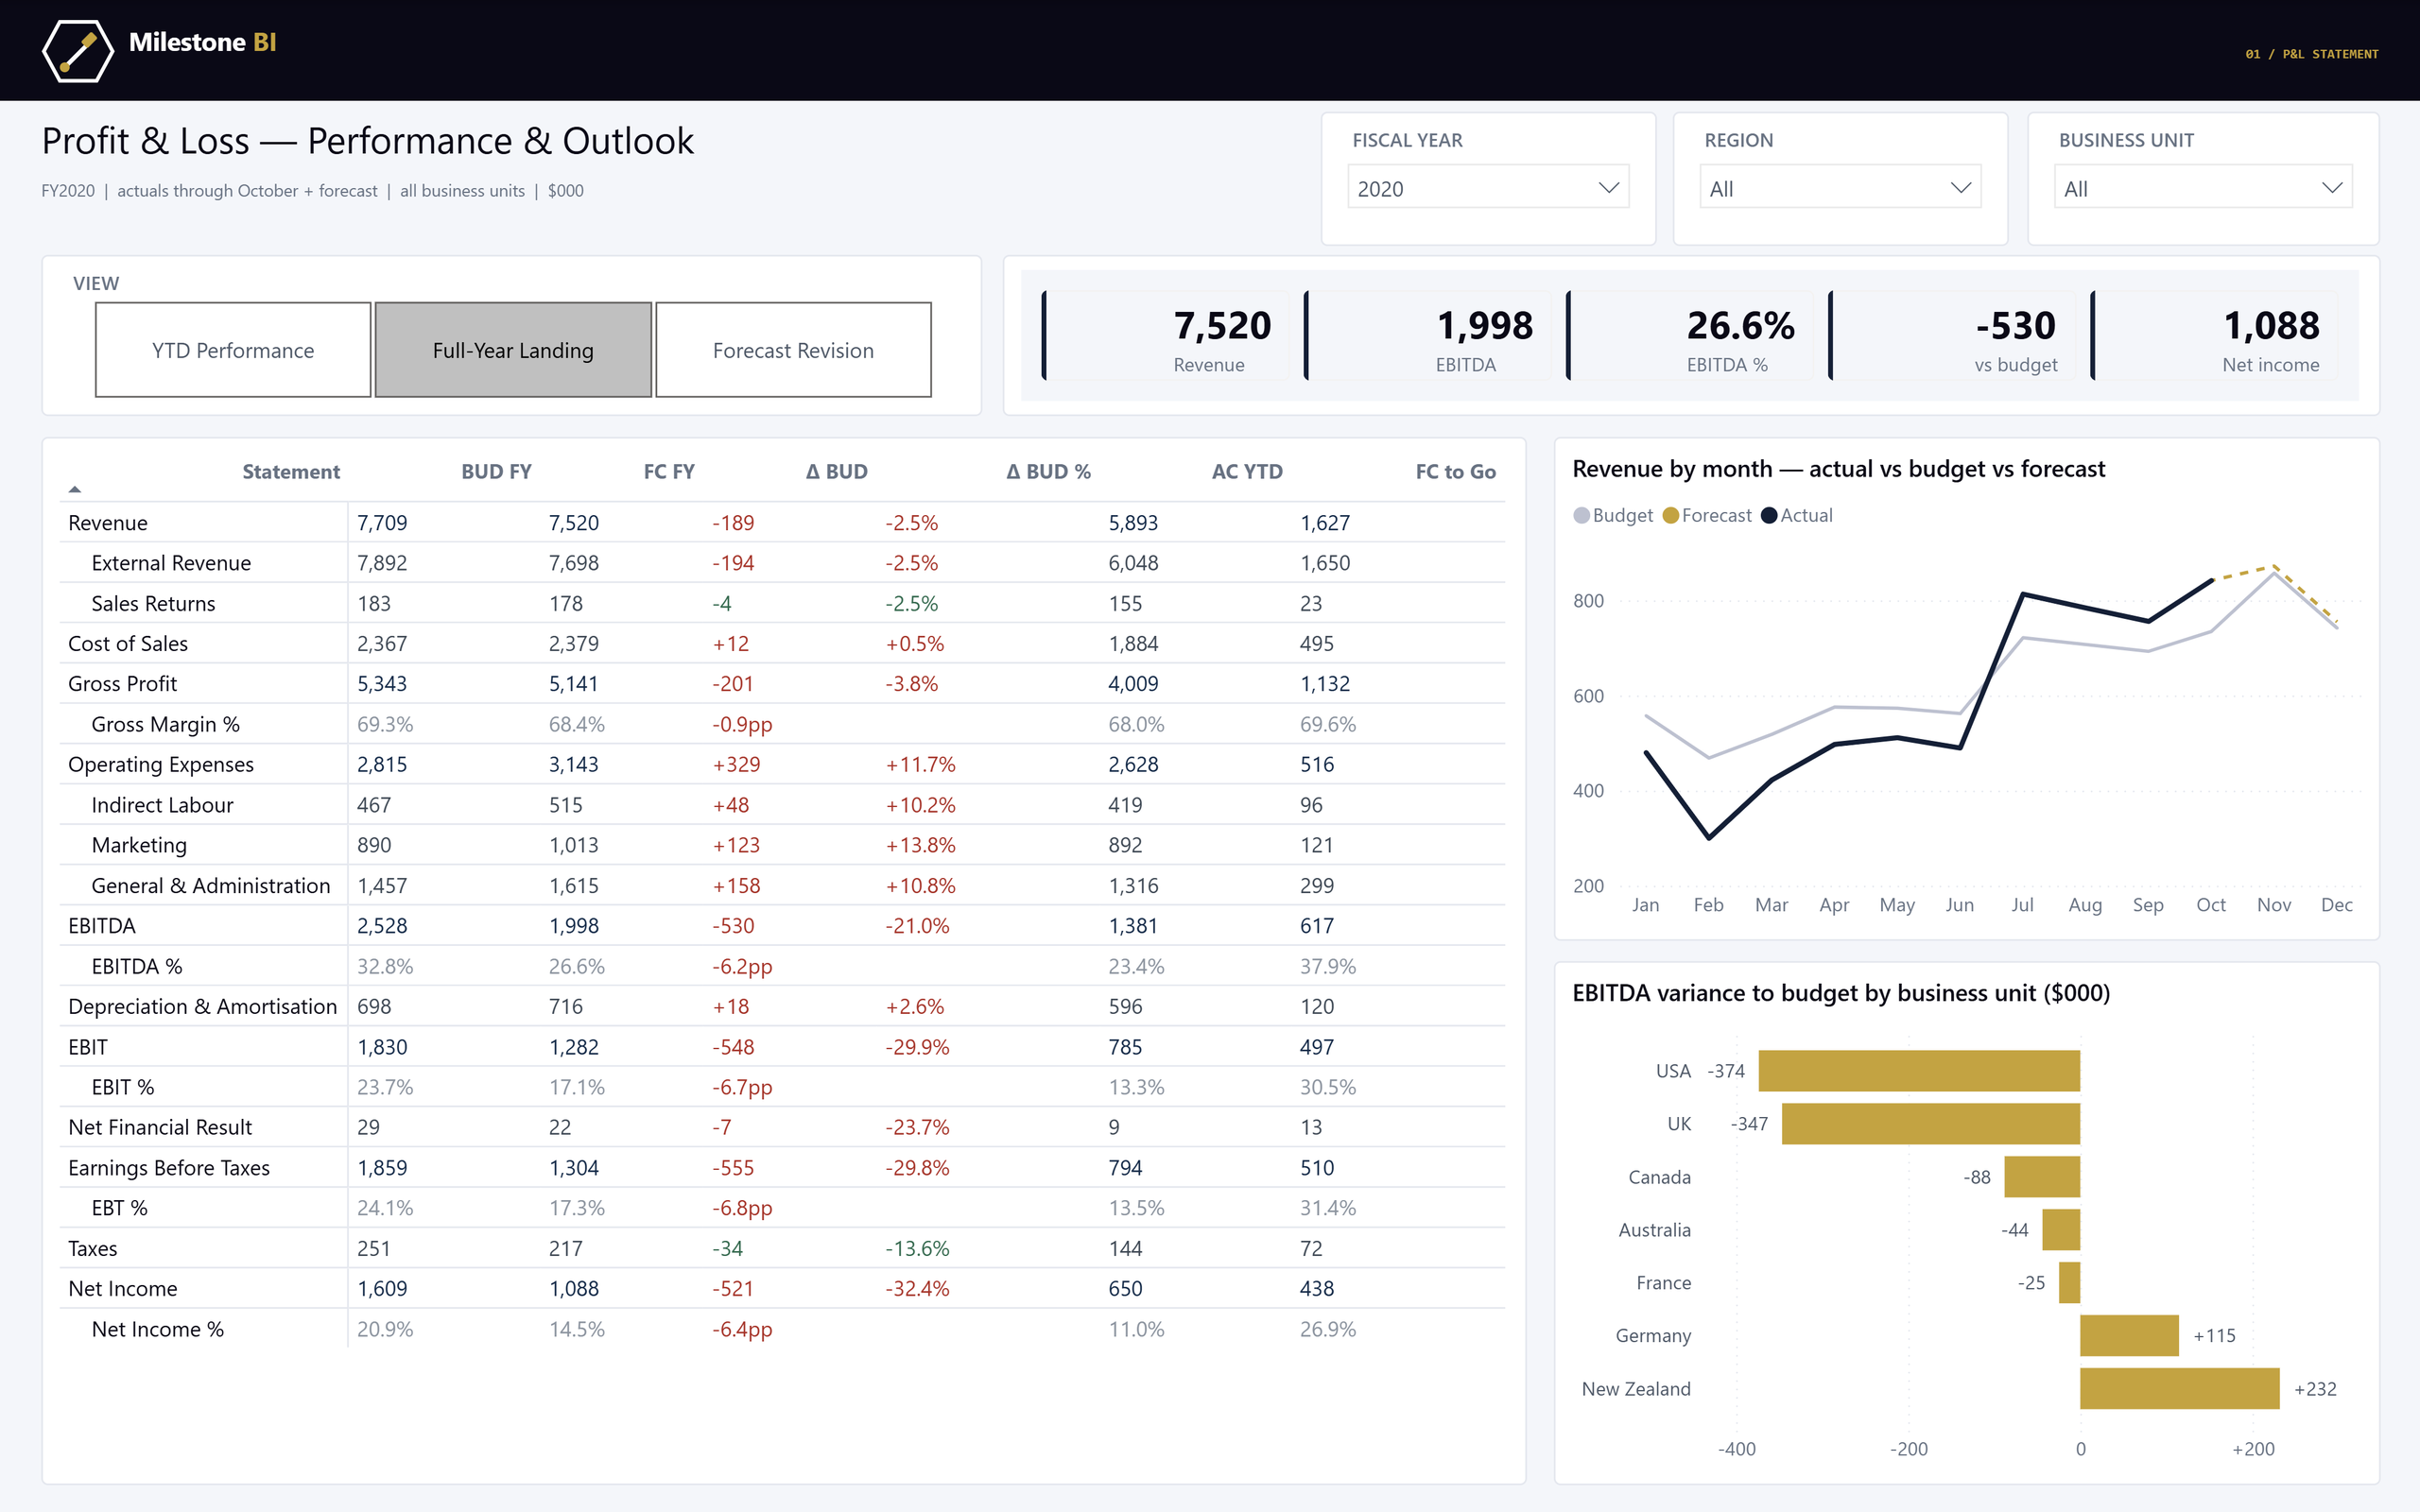
A Power BI profit and loss statement in the Milestone BI palette, showing budget, forecast and actual columns across 21 reporting lines, a monthly revenue chart and EBITDA variance by business unit.
POWER BI · OPEN SOURCE

P&L performance & outlook

A full profit & loss statement built from a real general ledger. Subtotal and detail lines share one matrix without double counting, and a single measure drives three column views.

Power BI · TMDL · DAX · Power Query · Python

Explore the data
PRODUCT · FREE TO TRY

Milestone Pulse

Turns a Power BI workspace export into a governance audit in seconds: over-privileged access, admin hygiene gaps and orphaned workspaces, flagged and explained.

Governance · PowerShell · Tenant audit

Open Pulse
Ready when you are

Let’s make your next decision the right one.

Talk to Milestone BI