
Superstore sales, 2021 to 2024
Four years of a US office-supplies retailer’s orders — the sample every Power BI course starts on, rebuilt properly. A star schema with a marked date table, nearly eighty measures that were checked against pandas before anything was drawn, and the charts below are the Power BI report redrawn for the web from the same numbers.
Sales by month, one line per year
One line per year on a January-to-December axis, so the seasonal shape and the growth are in the same picture. November and December carry every year; 2024 is the first to clear $100k in a month. Click a year to hide it.
Year by year
Growth arrived in 2023 and compounded. The customer count barely moved — the extra revenue came from the same people ordering more often.
| Year | Sales | vs prior year | Orders | Customers | New | Avg order |
|---|
Sub-categories ranked by sales, with the cumulative share
Seventeen sub-categories; the first five are more than half of everything. The label on each bar is the running share — the Pareto line from the report, as numbers.
Change on the prior year, by sub-category
Active customers by year, new against returning
“New” means a first ever order in that year. 589 of the 793 customers arrived in 2021 and eleven in 2024: this is a fixed panel of repeat buyers, so the interesting question is not who joins but who comes back.
Cohort retention
Read across a row: the share of each year’s new customers who ordered again in each later year. The cohort’s own year is 100% by definition. Retention rises with time here, which real customer bases do not do — a tell that the sample was built by sampling orders, not customers.
States ranked by sales
California and New York are a third of everything. The top fifteen are shown; the report carries all 49. Geography sits on the order line, not the customer, because 777 of the 793 customers order from more than one state.
How orders ship
Share of orders by ship mode, with the average calendar days from order to ship. Standard Class is six orders in ten at five days; Same Day is one in twenty and, as promised, instant.
Products ranked by sales
The top twenty of 1,893. One copier is 2.7% of four years of revenue on three orders. Click a column to sort.
Page 05: revenue against the comparison year
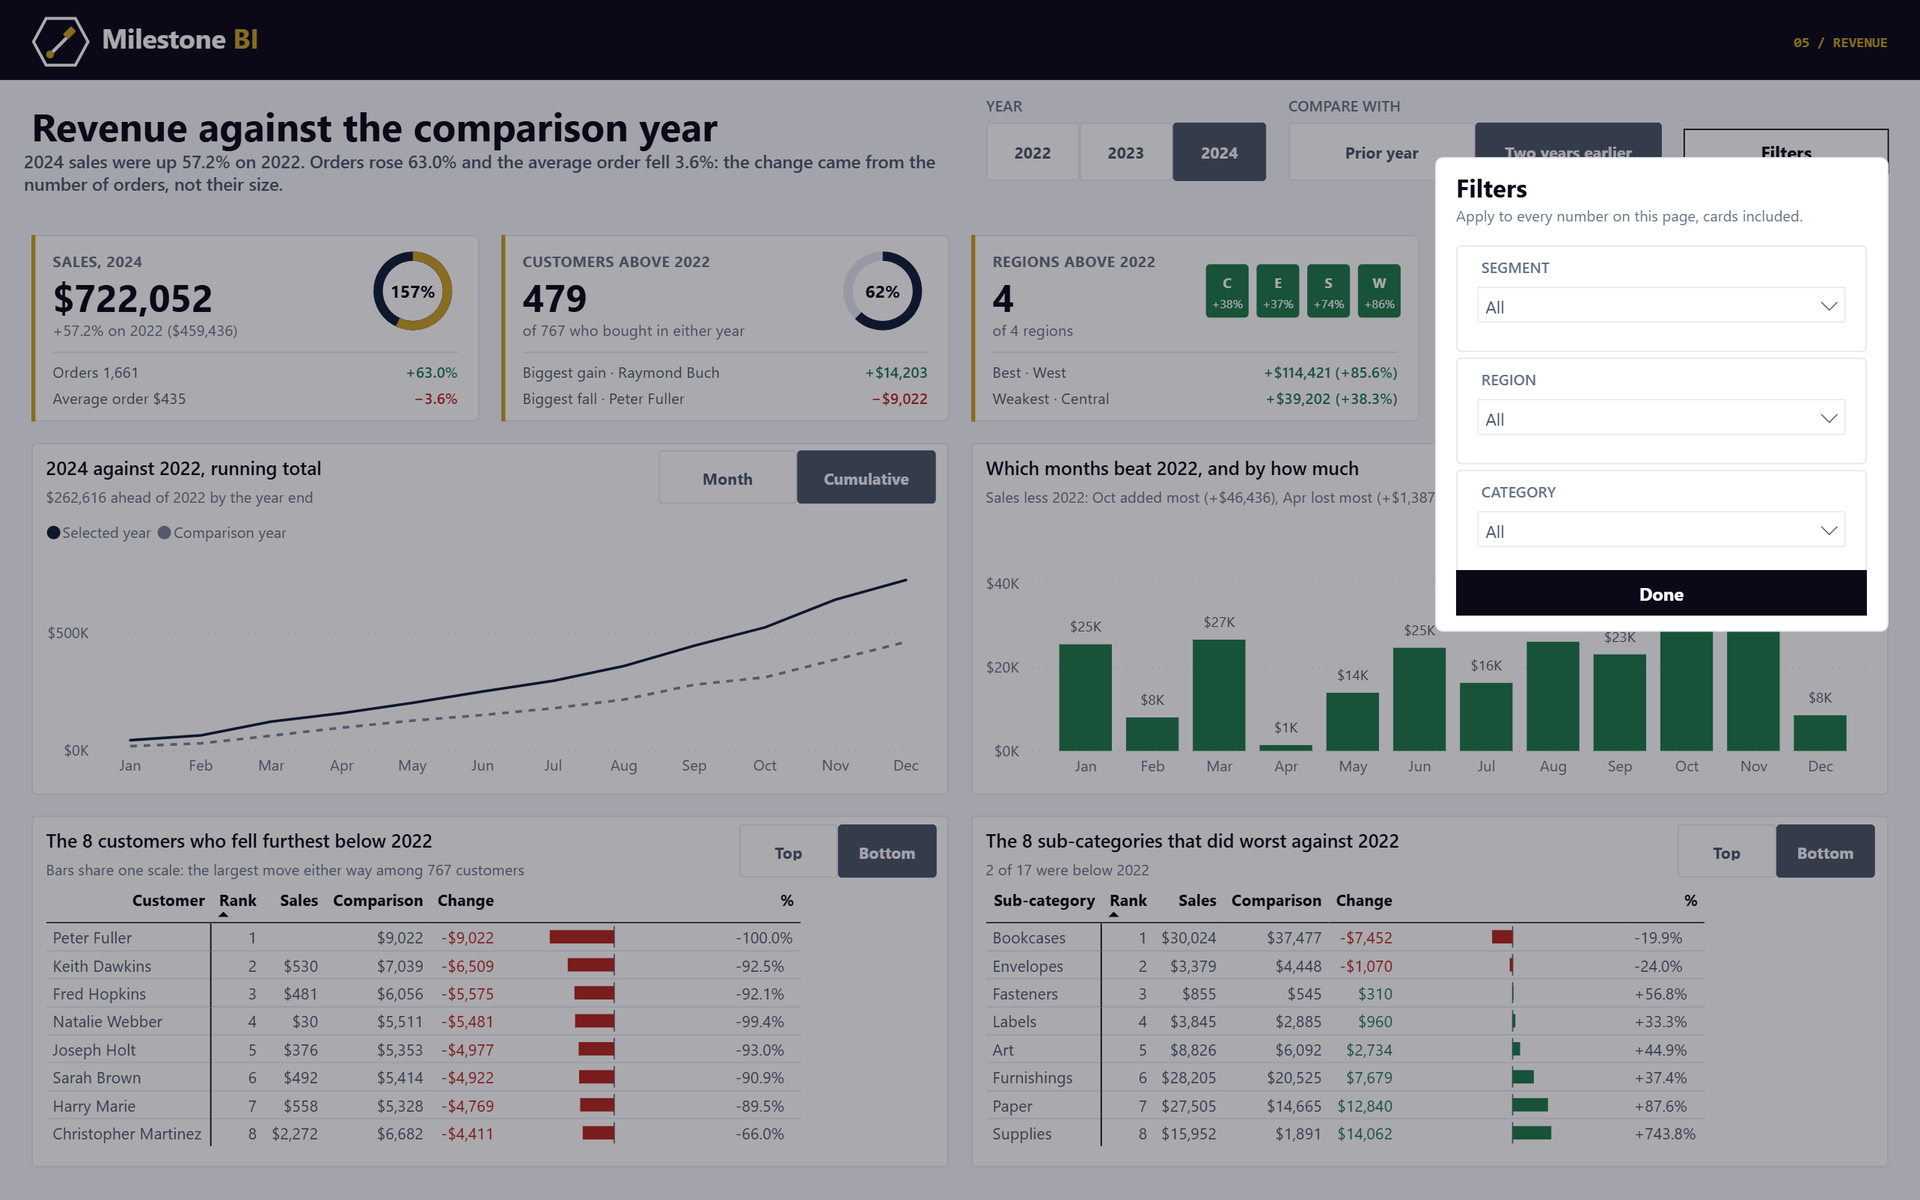
The one page shown here as the report itself rather than redrawn. 2024 sales were up 20.3% on 2023, but the average order fell 6.2% — the growth came from more orders, not bigger ones. Buttons pick the year, the comparison (prior year or two years earlier), month or running total, and the top or bottom eight on each table. Every block on it is a measure.
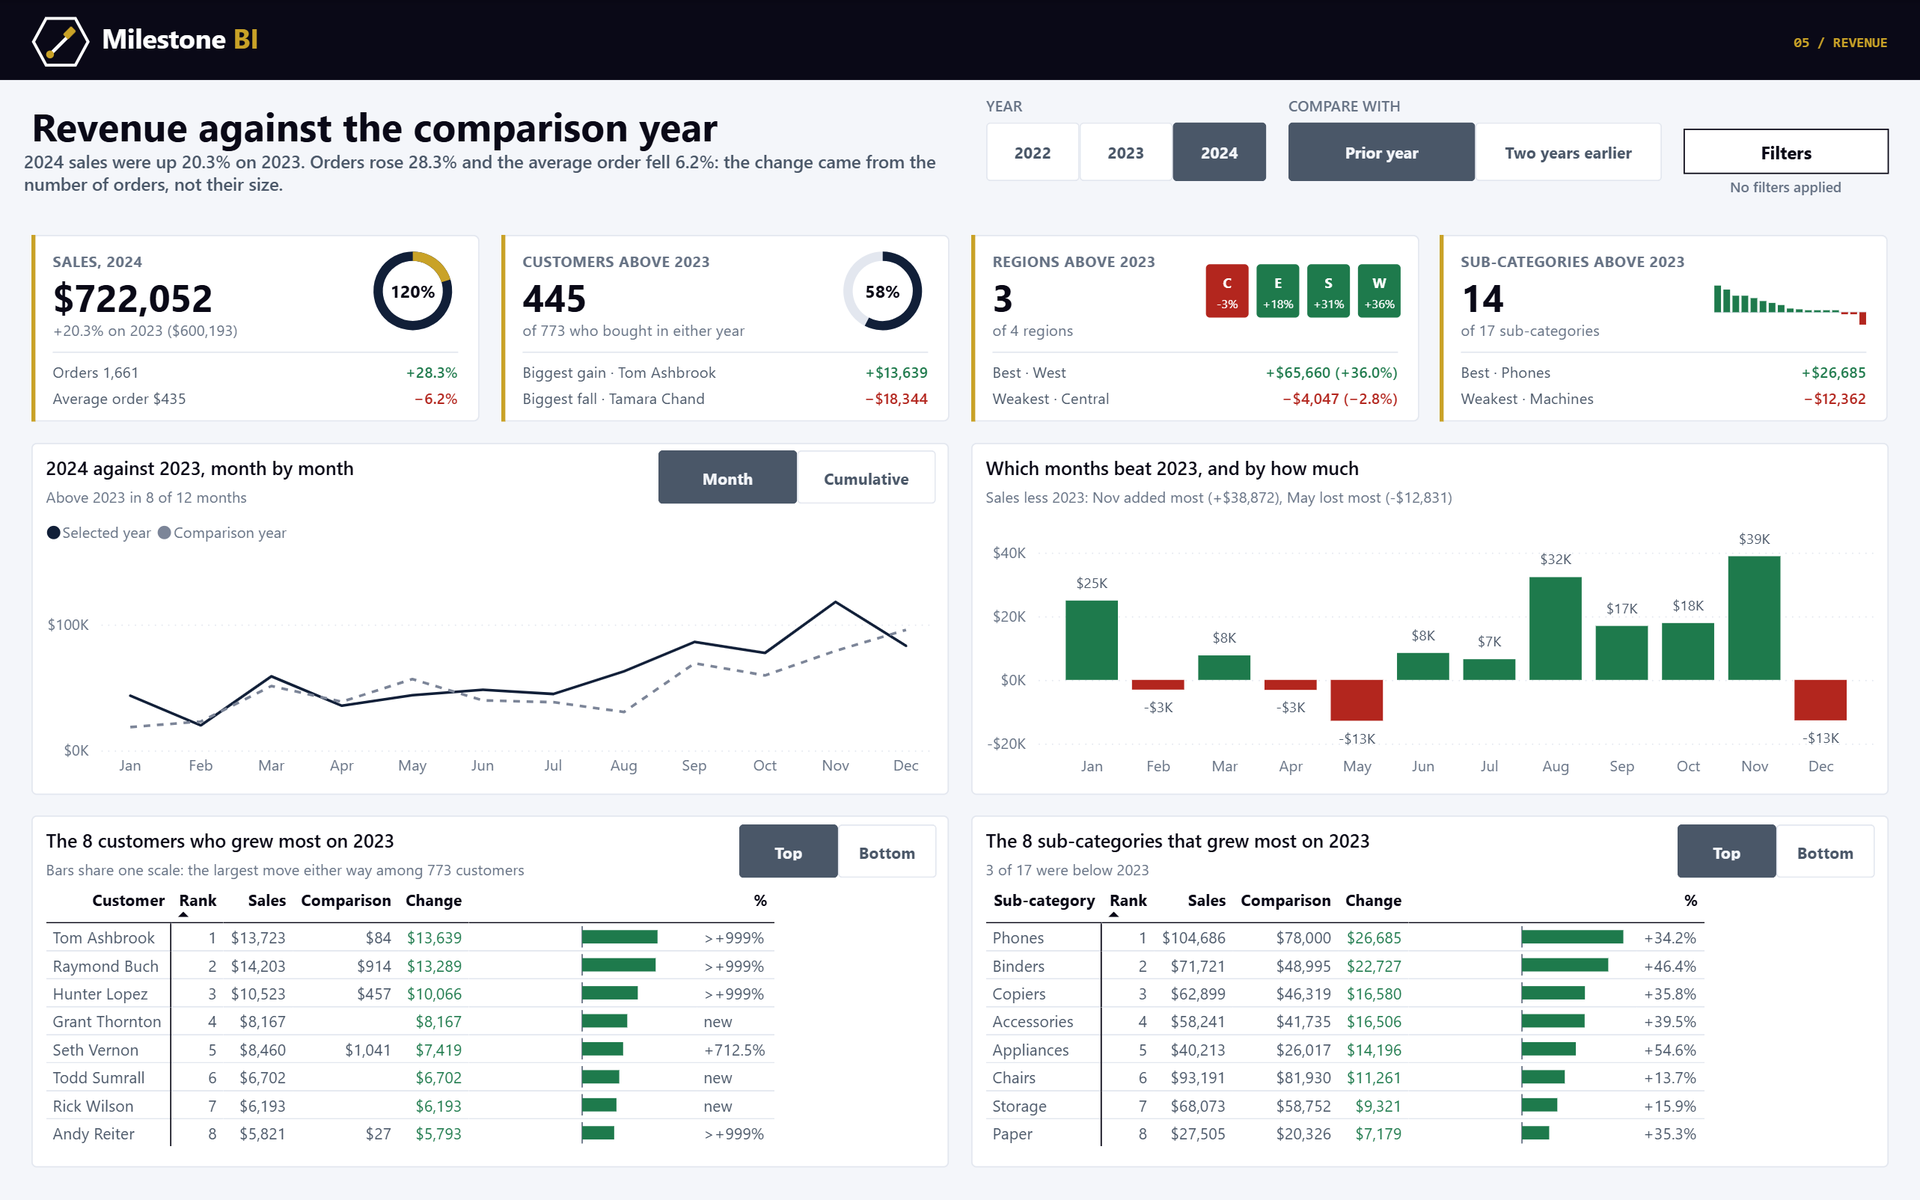
- The cards are SVG, drawn by DAX. Each card — ring gauge, region tiles, a bar per sub-category — is one measure returning an image, so it rewrites itself with every button and needs no custom visual.
- The toggles filter nothing. They sit on small tables with no relationships, and the measures read the choice. One measure serves both comparisons.
- Top or bottom eight, from one table. The rank is a measure whose direction follows the button. Its filter quietly shrank the pool the bars were scaled to, until the subtitle said “among 8 customers” and gave it away.
- A filter panel over the page. Two bookmarks show and hide it without touching any selection.
- Mocked up in HTML first, with the real numbers, then generated — and every figure checked against pandas for both comparisons.
What the source needed before any of this was true
-
The dates were moved. The extract covered 2017–2020, and the sample it
derives from is older still. Every order and ship date was shifted forward four whole years
so the report reads as current; the gap between order and ship is untouched. The year
token inside each Order ID (
CA-2015-103800) already trailed its order date by two years, so it was re-synced too, or it would have sat six years behind. - Product ID is not a key. 32 IDs carry two different product names, and 16 names sit under two IDs. Keying on either merges products that differ or splits ones that do not, so the product dimension is the (ID, name) pair — 1,893 of them — with a surrogate key.
- Postal codes lost their leading zero. The source stored them as numbers, so 429 New England and New Jersey codes arrived four digits long. They are text again, padded back to five. Eleven rows, all Burlington, Vermont, have no code at all and stay blank.
- Customers have no address. 777 of 793 customers order from more than one state. Geography belongs to the order line, not the customer, and the model is built that way — a customer dimension with a state on it would have been wrong for nearly all of them.
- The customer base is closed. New customers fall from 589 to 141 to 52 to 11, and retention rises over time. Neither happens in a real business; both happen when a sample is drawn by order rather than by customer. The customer page is built around retention because that is the only customer story this data can honestly tell.
- Two measures were wrong until they were cross-checked. Every figure on the report is computed twice — once in DAX, once in pandas with no DAX involved. That caught a “customers active in every year” measure returning 793 instead of 293: it counted years on the calendar table, which a fact table cannot filter, so every customer passed. It looked perfectly plausible on screen.
- No profit, quantity or discount. This is the 18-column Superstore extract, not the 21-column one, so it can say what sold and to whom, but not what it earned.